|

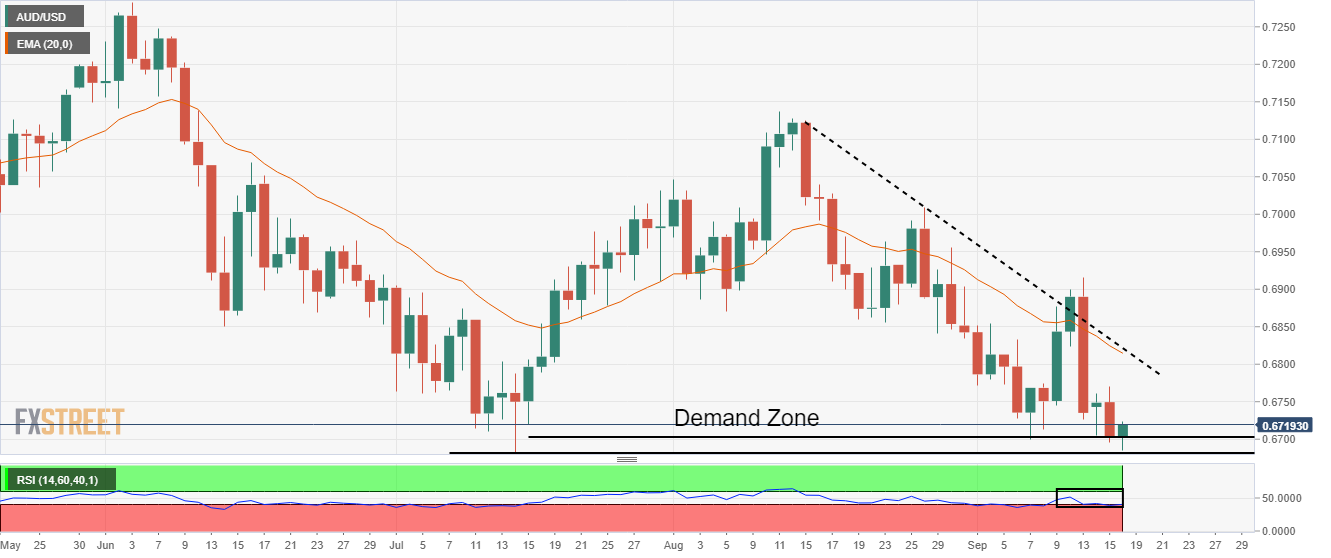
AUD/USD Price Analysis: Attempts a rebound near 0.6680-0.6700 demand zone

  • Aussie bulls have defended further downside after picking bids around 0.6680-0.6700 demand zone.
  • Declining 20-EMA at 0.6816 favor further weakness in the counter.
  • A decline into the bearish range by the RSI (14) will result in a fresh two-year low.

The AUD/USD pair has extended its recovery after overstepping the round-level hurdle of 0.6700 in the Tokyo session. The asset is advancing sharply and is expected to display a sustained pullback. On a broader note, the asset is defending its two-year low at around 0.6680.

The asset has attempted a firmer rebound after sensing a decent buying interest around the demand zone placed in a narrow range of 0.6680-0.6700 on a daily scale. The downward-sloping trendline paced from August 15 high at 0.7125 will act as a major hurdle for the aussie bulls.

The declining 20-period Exponential Moving Average (EMA) at 0.6816 favors the downside bias. Also, the Relative Strength Index (RSI) (14) is on the verge of slipping into the bearish range of 20.00-40.00, which will trigger a downside momentum.

A contra bet at this juncture could create a fortune for the market participants. A minor correction towards an intraday cushion around 0.6710 could be capitalized for initiating longs, which will send the asset towards Thursday’s high at 0.6770, followed by August 29 low at 0.6841.

Alternatively, a break below the above-mentioned demand zone will drag the asset towards the round-level support at 0.6600. A slippage below the latter will drag the asset towards 25 May 2020 low at 0.6520.

AUD/USD daily chart

AUD/USD

Overview
Today last price0.6722
Today Daily Change0.0020
Today Daily Change %0.30
Today daily open0.6702
 
Trends
Daily SMA200.6833
Daily SMA500.6891
Daily SMA1000.6955
Daily SMA2000.7109
 
Levels
Previous Daily High0.677
Previous Daily Low0.6696
Previous Weekly High0.6877
Previous Weekly Low0.6699
Previous Monthly High0.7137
Previous Monthly Low0.6835
Daily Fibonacci 38.2%0.6724
Daily Fibonacci 61.8%0.6742
Daily Pivot Point S10.6675
Daily Pivot Point S20.6649
Daily Pivot Point S30.6601
Daily Pivot Point R10.675
Daily Pivot Point R20.6797
Daily Pivot Point R30.6824

Author

Sagar Dua

Sagar Dua

FXStreet

Sagar Dua is associated with the financial markets from his college days. Along with pursuing post-graduation in Commerce in 2014, he started his markets training with chart analysis.

More from Sagar Dua
Share:

Markets move fast. We move first.

Orange Juice Newsletter brings you expert driven insights - not headlines. Every day on your inbox.

By subscribing you agree to our Terms and conditions.

Editor's Picks

EUR/USD ticks lower following the release of FOMC Minutes

The US Dollar found some near-term demand following the release of the FOMC meeting minutes, with the EUR/USD pair currently piercing the 1.1750 threshold. The document showed officials are still willing to trim interest rates. Meanwhile, thinned holiday trading keeps major pairs confined to familiar levels.

GBP/USD remains sub- 1.3500, remains in the red

The GBP/USD lost traction early in the American session, maintaining the sour tone and trading around 1.3460 following the release of the FOMC meeting minutes. Trading conditions remain thin ahead of the New Year holiday, limiting the pair's volatility.

Gold stable above $4,350 as the year comes to an end

Gold price got to recover some modest ground on Tuesday, holding on to intraday gains and changing hands at $4,360 a troy ounce in the American afternoon. The bright metal showed no reaction to the release of the FOMC December meeting minutes.

Ethereum: ETH holds above $2,900 despite rising selling activity

Ethereum (ETH) held the $2,900 level despite seeing increased selling pressure over the past week. The Exchange Netflow metric showed deposits outweighed withdrawals by about 400K ETH. The high value suggests rising selling activity amid the holiday season.

Economic outlook 2026-2027 in advanced countries: Solidity test

After a year marked by global economic resilience and ending on a note of optimism, 2026 looks promising and could be a year of solid economic performance. In our baseline scenario, we expect most of the supportive factors at work in 2025 to continue to play a role in 2026.

Crypto market outlook for 2026

Year 2025 was volatile, as crypto often is.  Among positive catalysts were favourable regulatory changes in the U.S., rise of Digital Asset Treasuries (DAT), adoption of AI and tokenization of Real-World-Assets (RWA).