- AUD/USD is taking on the bear's commitments is a significant correction.
- All eyes will be on the RBA 6 July meeting as the month draws towards a close.
AUD/USD ended the day flat on Friday at 0.7586 after ranging between 0.7579 and 0.7616 following a slide from the late European trade highs despite a softer greenback
The US dollar drifted lower as an agreement on US infrastructure spending underpinned appetite for other riskier currencies. However, the greenback recovered after tamer-than-expected producer price inflation as investors continued to evaluate whether the Federal Reserve will need to act faster in order to battle inflation risks.
However, the personal consumption expenditures (PCE) price index, excluding the volatile food and energy components, increased 0.5%, below economists’ expectations of an 0.6% increase. In the 12 months through May, the core PCE price index shot up 3.4%, the largest gain since April 1992.
Meanwhile, the Aussie dollar was able to shrug off some domestic woes as the spread of the Covid-19 Delta variant forced Sidney into lockdown. Instead, while the data calendar is rather uneventful beforehand, the Reserve Bank of Australia will be at the forefront of traders minds scheduled for 6th July.
The RBA would be expected to have shifted to the hawkish side after the June Federal Open Market Committee hawkish hold. The market is now pricing in 45bp of tightening in two-year time, up from 25bp before the Fed’s hawkish shift. AUD could benefit from the RBA sounding hawkish and is set to reduce stimulus at the July meeting. Other than that, AUD should remain mostly driven by external factors.
AUD/USD technical analysis
The correction eyes a test of the 61.8% Fibonacci given the bullish daily close and prospects of the wick being fille din on the ower time frames for the sessions ahead.
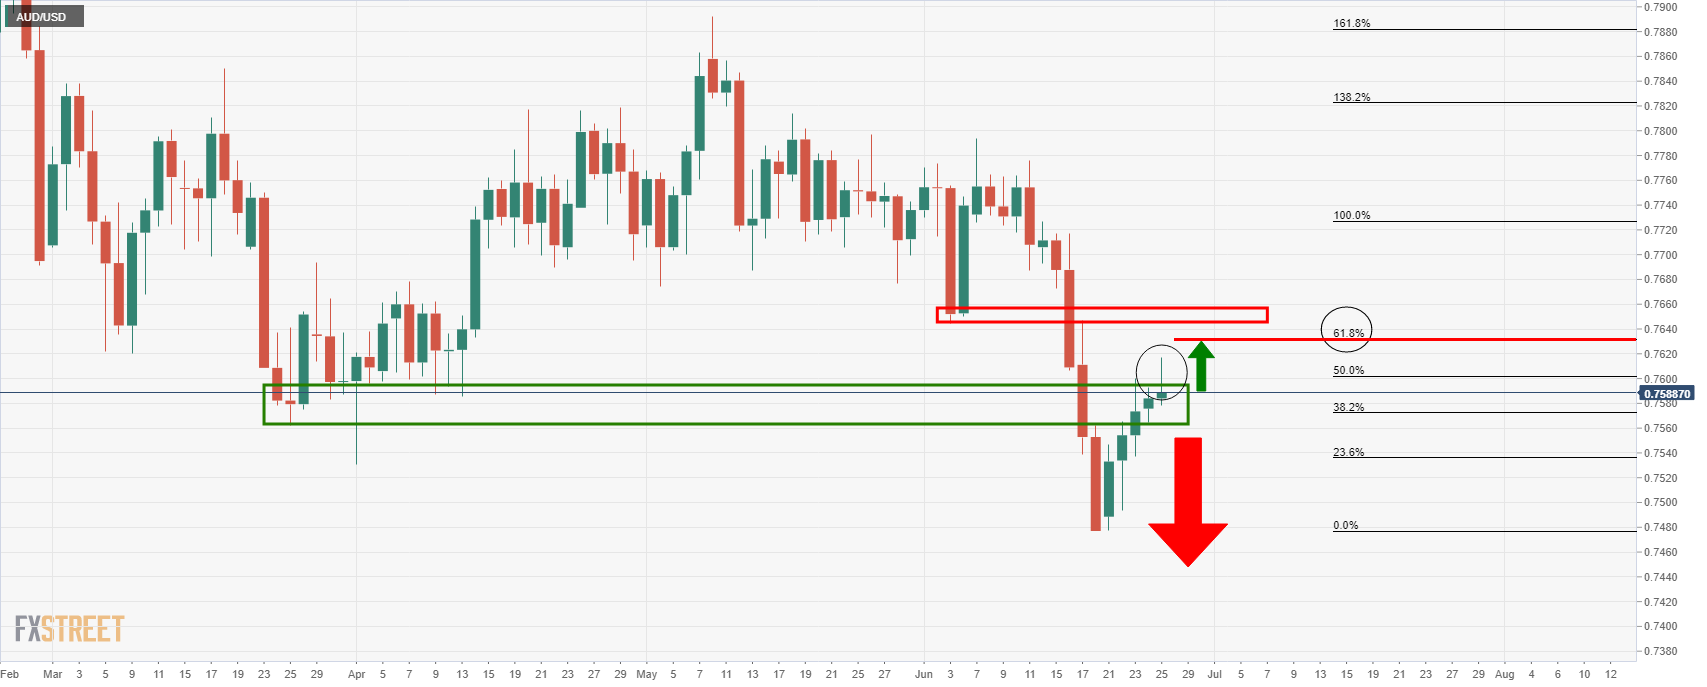
0.7650 is also an upside target marked by the prior early June lows.
However, scanning out the weekly chart, the first bearish scenario comes with the failed reverse head and shoulders:
Also, we have a double top as a result.
A downside continuation would be expected in the sessions ahead with prior structure at 0.7365/0.7410 as a target area.
Information on these pages contains forward-looking statements that involve risks and uncertainties. Markets and instruments profiled on this page are for informational purposes only and should not in any way come across as a recommendation to buy or sell in these assets. You should do your own thorough research before making any investment decisions. FXStreet does not in any way guarantee that this information is free from mistakes, errors, or material misstatements. It also does not guarantee that this information is of a timely nature. Investing in Open Markets involves a great deal of risk, including the loss of all or a portion of your investment, as well as emotional distress. All risks, losses and costs associated with investing, including total loss of principal, are your responsibility. The views and opinions expressed in this article are those of the authors and do not necessarily reflect the official policy or position of FXStreet nor its advertisers. The author will not be held responsible for information that is found at the end of links posted on this page.
If not otherwise explicitly mentioned in the body of the article, at the time of writing, the author has no position in any stock mentioned in this article and no business relationship with any company mentioned. The author has not received compensation for writing this article, other than from FXStreet.
FXStreet and the author do not provide personalized recommendations. The author makes no representations as to the accuracy, completeness, or suitability of this information. FXStreet and the author will not be liable for any errors, omissions or any losses, injuries or damages arising from this information and its display or use. Errors and omissions excepted.
The author and FXStreet are not registered investment advisors and nothing in this article is intended to be investment advice.
Recommended content
Editors’ Picks

Gold nears $3,400; fresh record highs and counting amid USD sell-off
Gold price closes in on $3,400 as the record rally regains strength on Easter Monday. Concerns over US-China trade war escalation and the Fed’s independence smash the US Dollar to three-year troughs. RSI stays overbought on the daily chart, with thin volumes likely to exaggerate moves in Gold price.

EUR/USD extends rally toward 1.1600 as US Dollar keeps falling
EUR/USD trades roughly 1.5% higher so far this Monday as the relentless US Dollar selling drives it toward the 1.1600 threshold - the highest level since November 2021. Growing concerns over a US economic recession and the Federal Reserve’s autonomy continue to exert downward pressure on the USD.

GBP/USD surges past 1.3400 on intense US Dollar weakness
GBP/USD continues its winning streak, recapturing 1.3400 in European trading on Monday. The extended US Dollar weakness, amid US-Sino trade war-led recession fears and heightened threat to the Fed's independence, continue to underpin the pair. Thin trading is set to extend.

How to make sense of crypto recovery – Is it a buy or fakeout
Bitcoin (BTC), Ethereum (ETH) and XRP, the top three cryptocurrencies by market capitalization, extend their last week’s recovery on Monday, even as trader sentiment is hurt by the US President Donald Trump’s tariff policy and announcements.

Five fundamentals for the week: Traders confront the trade war, important surveys, key Fed speech Premium
Will the US strike a trade deal with Japan? That would be positive progress. However, recent developments are not that positive, and there's only one certainty: headlines will dominate markets. Fresh US economic data is also of interest.

The Best brokers to trade EUR/USD
SPONSORED Discover the top brokers for trading EUR/USD in 2025. Our list features brokers with competitive spreads, fast execution, and powerful platforms. Whether you're a beginner or an expert, find the right partner to navigate the dynamic Forex market.