- AUD/USD slumped back toward Wednesday’s opening bids after a CPI-fueled run.
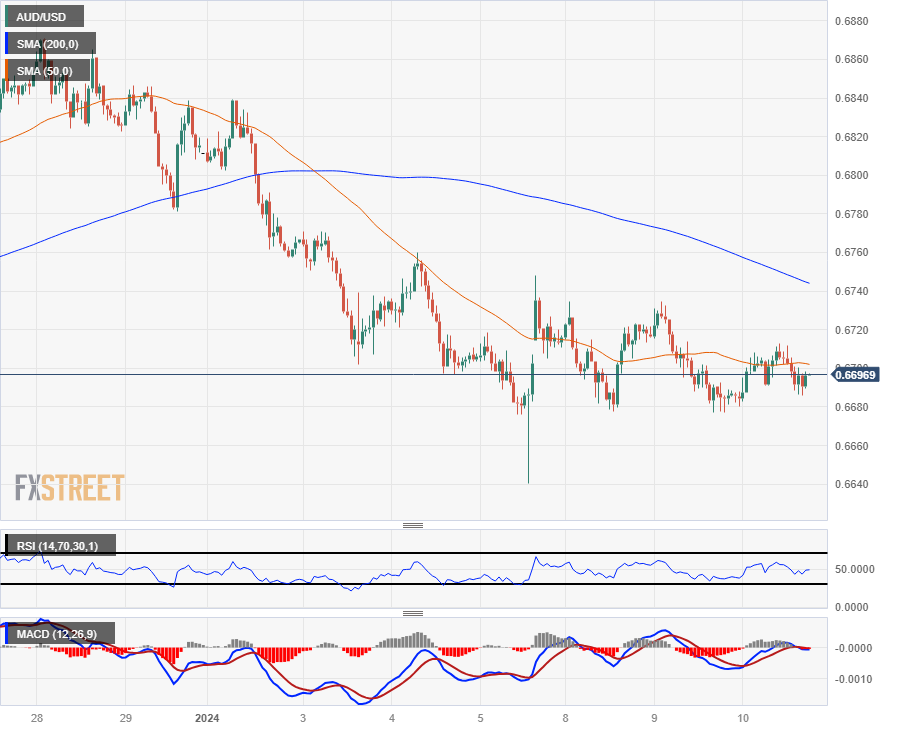
- The Aussie couldn’t hold onto territory above 0.6710.
- US CPI inflation expectations are weighing down risk appetite for the midweek.
The AUD/USD initially rose on Wednesday after Australian Consumer Price Index (CPI) inflation figures showed inflation cooling faster than market forecasts predicted. The pair climbed over the 0.6700 handle to hit an intraday high of 0.6713, but the pair is waffling back into the low side of 0.6700 as markets gear up for Thursday’s US CPI inflation print.
Australia’s November CPI comes in at 4.3% YoY vs. 4.4% expected
Australian CPI inflation for the year ended November slipped to 4.3% versus the median market forecast of 4.4% and fell even further from October’s YoY print of 4.9%. With inflation pressures easing, Aussie bulls found a reason to bid, but buying pressure proved short-lived as markets turn broad-face to look towards Thursday’s US CPI inflation print.
US CPI Preview: Forecasts from 10 major banks
Market participants are hoping for signs that the Federal Reserve (Fed) will get pushed into the next rate-cutting cycle sooner rather than later, and major investors are looking for easing inflation to be the spark the Fed needs to begin slashing its main reference rate. Despite broad-market hopes, market forecasts see the headline US CPI inflation print for December to come in at 0.2% MoM compared to November’s print of 0.1%.
Annualized US CPI inflation through December is likewise expected to tick slightly higher from 3.1% to 3.2%, while Core MoM CPI is expected to hold steady at 0.3%.
With investors hoping for signs of easing long-term inflation to kickstart the next rate cut cycle, markets will be focusing on annualized Core CPI through December, which is forecast to slightly decline from 4.0% to 3.8%.
AUD/USD Technical Outlook
The AUD/USD is cycling the 50-hour Simple Moving Average (SMA), hitting the price median for a fifth consecutive day as momentum drains out of the pair. The AUD/USD sees descending resistance from a declining 200-hour SMA falling into 0.6740.
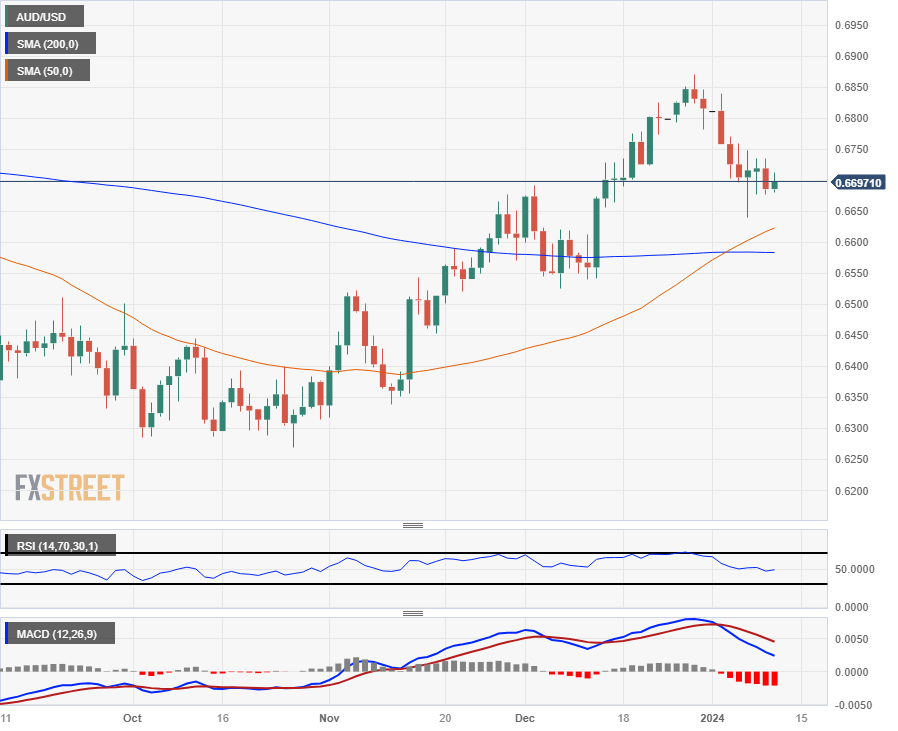
The AUD/USD has fallen around 2.5% from late December’s swing high into 0.68711, but near-term technical support is priced in from a 50-day and 200-day SMA crossover near the 0.6600 handle.
AUD/USD Hourly Chart

AUD/USD Daily Chart

AUD/USD Technical Levels
Information on these pages contains forward-looking statements that involve risks and uncertainties. Markets and instruments profiled on this page are for informational purposes only and should not in any way come across as a recommendation to buy or sell in these assets. You should do your own thorough research before making any investment decisions. FXStreet does not in any way guarantee that this information is free from mistakes, errors, or material misstatements. It also does not guarantee that this information is of a timely nature. Investing in Open Markets involves a great deal of risk, including the loss of all or a portion of your investment, as well as emotional distress. All risks, losses and costs associated with investing, including total loss of principal, are your responsibility. The views and opinions expressed in this article are those of the authors and do not necessarily reflect the official policy or position of FXStreet nor its advertisers. The author will not be held responsible for information that is found at the end of links posted on this page.
If not otherwise explicitly mentioned in the body of the article, at the time of writing, the author has no position in any stock mentioned in this article and no business relationship with any company mentioned. The author has not received compensation for writing this article, other than from FXStreet.
FXStreet and the author do not provide personalized recommendations. The author makes no representations as to the accuracy, completeness, or suitability of this information. FXStreet and the author will not be liable for any errors, omissions or any losses, injuries or damages arising from this information and its display or use. Errors and omissions excepted.
The author and FXStreet are not registered investment advisors and nothing in this article is intended to be investment advice.
Recommended content
Editors’ Picks

EUR/USD posts small gains near 1.0400 ahead of Eurozone inflation data
EUR/USD is trading with modest gains at around 1.0400 in the European trading hours on Tuesday. The sustained US Dollar weakness and profit-taking ahead of the Eurozone inflation data underpin the pair. US ISM Services PMI and Job Openings data are also awaited.

GBP/USD stays firm toward 1.2550 amid weaker US Dollar
GBP/USD keeps its bid tone intact, eyeing 1.2550 in Tuesday's European morning. The pair's advance is driven by a broadly subdued US Dollar but the further upisde could be capped by a mixed market mood heading into the US data releases.

Gold price steadily climb back closer to $2,650, lacks follow-through
Gold price attracts some haven flows amid worries about Trump’s tariff plans. The Fed’s hawkish shift and elevated US bond yields could cap the XAU/USD. Traders now keenly await FOMC minutes and US NFP releases later this week.

Solana Price Forecast: Open Interest reaches an all-time high of $6.48 billion
Solana price trades slightly down on Tuesday after rallying more than 12% the previous week. On-chain data hints for rallying continuation as SOL’s open interest reaches a new all-time high of $6.48 billion on Tuesday.

Five fundamentals for the week: Nonfarm Payrolls to keep traders on edge in first full week of 2025 Premium
Did the US economy enjoy a strong finish to 2024? That is the question in the first full week of trading in 2025. The all-important NFP stand out, but a look at the Federal Reserve and the Chinese economy is also of interest.

Best Forex Brokers with Low Spreads
VERIFIED Low spreads are crucial for reducing trading costs. Explore top Forex brokers offering competitive spreads and high leverage. Compare options for EUR/USD, GBP/USD, USD/JPY, and Gold.