|

AUD/USD declines into near-term lows around 0.6680 despite Aussie Retail Sales beat

  • The Aussie lost ground on Tuesday, paring away intraday gains.
  • Broader markets are favoring the US Dollar heading into the midweek.
  • This week hinges on US CPI inflation figures due on Thursday.

The AUD/USD slid back into recent lows on Tuesday, paring back Wednesday’s limited bounce as the Australian Dollar (AUD) shrugged off an upside beat in Australian Retail Sales. The US Dollar (USD) saw broad-market uptake on the day as investors adjusted their risk profile heading into the midweek.

Australia’s Retail Sales and Building Permits both beat expectations

Australia’s Retail Sales in November climbed 2% MoM, well above the 1.2% forecast and rebounded from October’s -0.4% decline, which saw a downside revision from -0.2%. Australian Building Permits also beat forecasts, printing at 1.6% in November, well back from October’s 7.2% (revised down slightly from 7.5%) but still above the market’s -2.0% forecast.

Australian Building Permits likewise beat the street, showing 2% growth in November versus the forecast 1.2%. October’s Building Permits were revised slightly lower from 7.5% to 7.2%.

US Data was thin on Tuesday, and markets will be broadly turning focus towards Thursday’s US Consumer Price Index (CPI) inflation figures as investors look to draw a bead on future Federal Reserve (Fed) rate cuts. Last Friday’s Nonfarm Payrolls disappointed market participants hoping for a faster, deeper pace of rate cuts in 2024, as healthier jobs data makes it harder for the Fed to get pushed into a rate cut cycle.

AUD/USD Technical Outlook

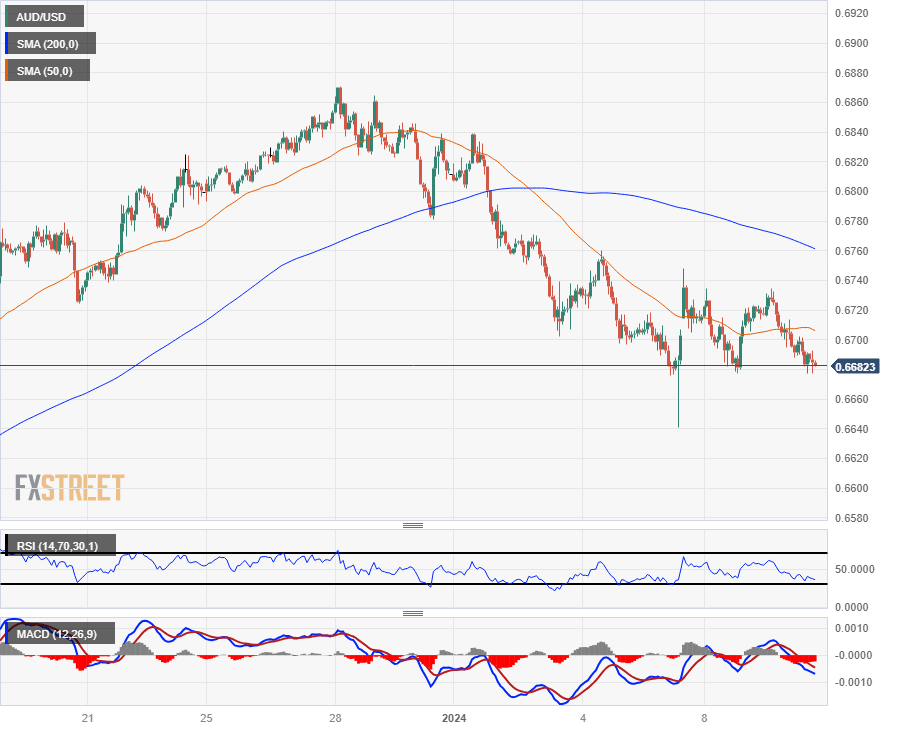
The AUD/USD has settled back into familiar near-term lows near 0.6680 as intraday action gets capped underneath the 200-hour Simple Moving Average (SMA) near 0.6760. The Aussie is down 2.75% against the US Dollar from late December’s peak of 0.6871.

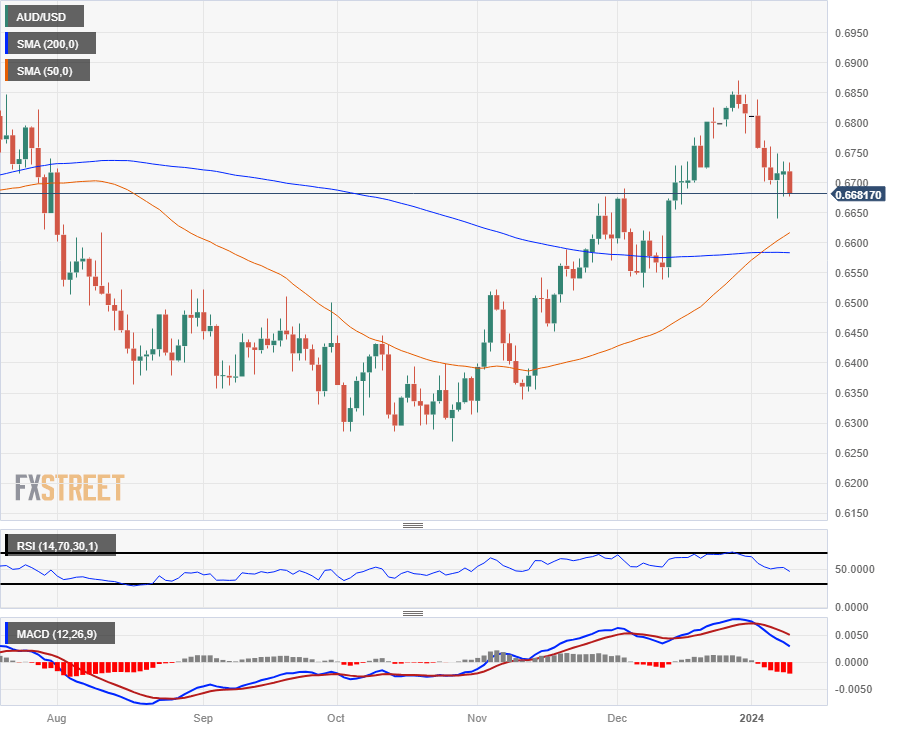
The AUD/USD’s near-term decline has the pair getting dragged back towards the 200-day SMA on daily candlesticks, approaching the 0.6600 handle as price action descends into a technical support zone following a bullish crossover of the 50-day and 200-day SMAs.

AUD/USD Hourly Chart

AUD/USD Daily Chart

AUD/USD Technical Levels

AUD/USD

Overview
Today last price0.6683
Today Daily Change-0.0036
Today Daily Change %-0.54
Today daily open0.6719
 
Trends
Daily SMA200.6749
Daily SMA500.661
Daily SMA1000.6502
Daily SMA2000.6584
 
Levels
Previous Daily High0.6735
Previous Daily Low0.6678
Previous Weekly High0.6839
Previous Weekly Low0.6641
Previous Monthly High0.6871
Previous Monthly Low0.6526
Daily Fibonacci 38.2%0.6713
Daily Fibonacci 61.8%0.6699
Daily Pivot Point S10.6686
Daily Pivot Point S20.6653
Daily Pivot Point S30.6629
Daily Pivot Point R10.6743
Daily Pivot Point R20.6768
Daily Pivot Point R30.6801

Author

Joshua Gibson

Joshua joins the FXStreet team as an Economics and Finance double major from Vancouver Island University with twelve years' experience as an independent trader focusing on technical analysis.

More from Joshua Gibson
Share:

Markets move fast. We move first.

Orange Juice Newsletter brings you expert driven insights - not headlines. Every day on your inbox.

By subscribing you agree to our Terms and conditions.

Editor's Picks

EUR/USD clings to small gains near 1.1750

Following a short-lasting correction in the early European session, EUR/USD regains its traction and clings to moderate gains at around 1.1750 on Monday. Nevertheless, the pair's volatility remains low, with investors awaiting this weeks key US data releases and the ECB policy announcements.

GBP/USD edges higher toward 1.3400 as traders await key data and BoE

GBP/USD reverses its direction and advances toward 1.3400 following a drop to the 1.3350 area earlier in the day. The US Dollar struggles to gather recovery momentum as markets await Tuesday's Nonfarm Payrolls data, while the Pound Sterling holds steady ahead of the BoE policy announcements later in the week.

Gold builds on previous week's gains, approaches $4,350

Gold preserves its bullish momentum after rising more than 2% last week and climbs toward $4,350 on Monday. The precious metal extends its upside as the US Dollar remains on the back foot on growing expectations for a dovish Fed policy outlook next year.

Solana consolidates as spot ETF inflows near $1 billion signal institutional dip-buying

Solana price hovers above $131 at the time of writing on Monday, nearing the upper boundary of a falling wedge pattern, awaiting a decisive breakout. On the institutional side, demand for spot Solana Exchange-Traded Funds remained firm, pushing total assets under management to nearly $1 billion since launch. 

Big week ends with big doubts

The S&P 500 continued to push higher yesterday as the US 2-year yield wavered around the 3.50% mark following a Federal Reserve (Fed) rate cut earlier this week that was ultimately perceived as not that hawkish after all. The cut is especially boosting the non-tech pockets of the market.

Solana Price Forecast: SOL consolidates as spot ETF inflows near $1 billion signal institutional dip-buying

Solana (SOL) price hovers above $131 at the time of writing on Monday, nearing the upper boundary of a falling wedge pattern, awaiting a decisive breakout.