AUD/JPY technical analysis: 50% Fibo. guards near-term upside
- Frequent failure to cross 50% Fibonacci retracement portrays the AUD/JPY pair’s weakness.
- 200-HMA, 7-day old trend-line act as nearby supports.

Despite a week-long ascending trend-line portraying the AUD/JPY pair’s gradual recovery, 50% Fibonacci retracement level continues to act as a near-term strong resistance considering the quote’s latest decline to 74.60 during early Tuesday.
While 200-hour moving average (200-HMA) level of 74.56 seems adjacent support, pair’s further declines will be capped by 23.6% Fibonacci retracement and aforementioned trend-line around 74.35/30.
If sellers manage to drag the pair below 74.30, 74.00 and latest low surrounding 73.92 could flash on their radars.
On the flip side, the successful break of 50% Fibonacci retracement of 74.80 can trigger the pair’s move up towards 61.8% Fibonacci retracement level near 75.00.
Additionally, pair’s sustained rise above 75.00 enables buyers to aim for 75.40 and recent tops near 75.70.
AUD/JPY hourly chart
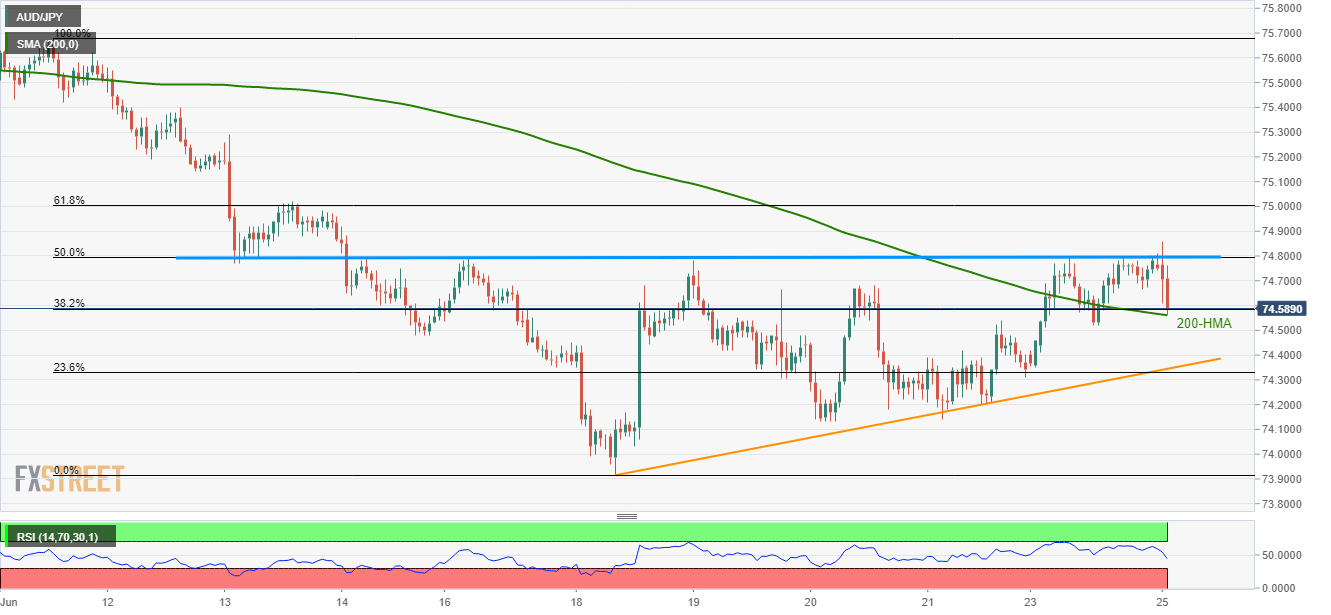
Trend: Bearish
Author

Anil Panchal
FXStreet
Anil Panchal has nearly 15 years of experience in tracking financial markets. With a keen interest in macroeconomics, Anil aptly tracks global news/updates and stays well-informed about the global financial moves and their implications.


