|

AUD/JPY technical analysis: 2-week old resistance-line raises doubts on bullish MACD

  • AUD/JPY remains below short-term trend-line resistance despite bullish MACD.
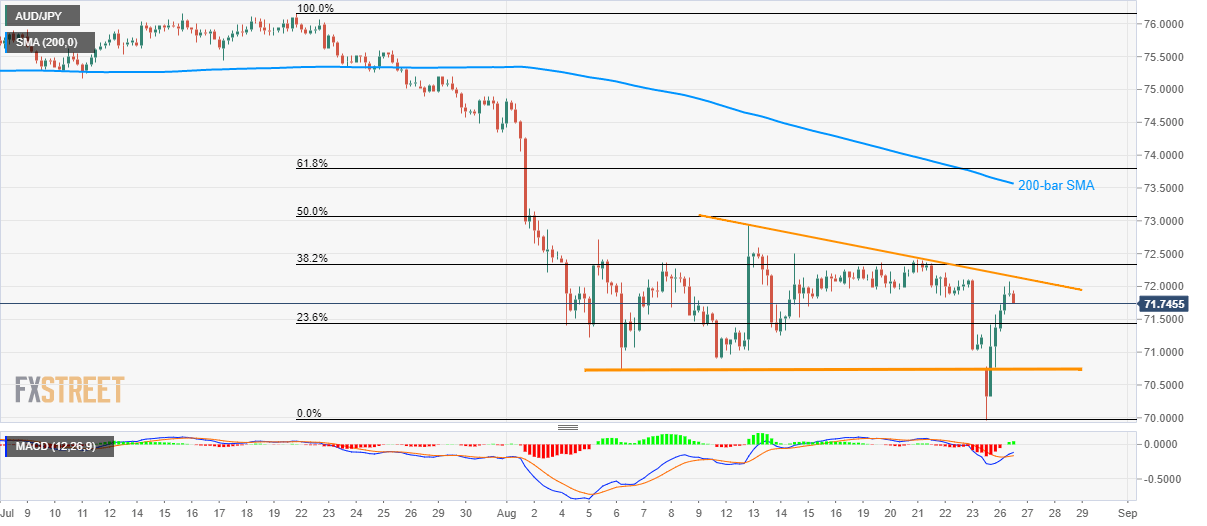
  • 200-bar SMA can please buyers on the upside break while 70.78/74 becomes immediate key support area.

Although recovery from multi-year low, coupled with bullish MACD, portrays the strength of buying momentum, failure to cross immediate resistance-line speaks for the sellers as the AUD/JPY pair trades around 71.90 during Tuesday morning in Asia.

The bullish signal of 12-bar moving average convergence and divergence (MACD) increases the odds for the pair’s run-up towards 200-bar simple moving average (SMA) level of 73.57. However, pair’s sustained break of the two-week-old descending trend-line, at 72.12, followed by a rise above 50% Fibonacci retracement level of July-August downpour close to 73.07, becomes necessary to please the buyers.

During the pair’s trading below 72.12 resistance-line, 23.6% Fibonacci retracement level of 71.44 and a horizontal area around 70.78/74, including August 07 low and yesterday’s extreme levels, can act as nearby support.

Should prices keep declining below 70.74, Monday’s low around 70.00 becomes the key to watch as a break of which could extend the declines towards March 2009 high near 69.60 and then to April 2009 bottom surrounding 66.80.

AUD/JPY 4-hour chart

Trend: Bearish

    1. R3 72.96 
    2. R2 72.53 
    3. R1 71.88 
  1. PP 71.45
    1. S1  70.8
    2. S2  70.37
    3. S3  69.71

Author

Anil Panchal

Anil Panchal

FXStreet

Anil Panchal has nearly 15 years of experience in tracking financial markets. With a keen interest in macroeconomics, Anil aptly tracks global news/updates and stays well-informed about the global financial moves and their implications.

More from Anil Panchal
Share:

Markets move fast. We move first.

Orange Juice Newsletter brings you expert driven insights - not headlines. Every day on your inbox.

By subscribing you agree to our Terms and conditions.

Editor's Picks

EUR/USD clings to small gains near 1.1750

Following a short-lasting correction in the early European session, EUR/USD regains its traction and clings to moderate gains at around 1.1750 on Monday. Nevertheless, the pair's volatility remains low, with investors awaiting this weeks key US data releases and the ECB policy announcements.

GBP/USD edges higher toward 1.3400 as traders await key data and BoE

GBP/USD reverses its direction and advances toward 1.3400 following a drop to the 1.3350 area earlier in the day. The US Dollar struggles to gather recovery momentum as markets await Tuesday's Nonfarm Payrolls data, while the Pound Sterling holds steady ahead of the BoE policy announcements later in the week.

Gold builds on previous week's gains, approaches $4,350

Gold preserves its bullish momentum after rising more than 2% last week and climbs toward $4,350 on Monday. The precious metal extends its upside as the US Dollar remains on the back foot on growing expectations for a dovish Fed policy outlook next year.

Solana consolidates as spot ETF inflows near $1 billion signal institutional dip-buying

Solana price hovers above $131 at the time of writing on Monday, nearing the upper boundary of a falling wedge pattern, awaiting a decisive breakout. On the institutional side, demand for spot Solana Exchange-Traded Funds remained firm, pushing total assets under management to nearly $1 billion since launch. 

Big week ends with big doubts

The S&P 500 continued to push higher yesterday as the US 2-year yield wavered around the 3.50% mark following a Federal Reserve (Fed) rate cut earlier this week that was ultimately perceived as not that hawkish after all. The cut is especially boosting the non-tech pockets of the market.

Solana Price Forecast: SOL consolidates as spot ETF inflows near $1 billion signal institutional dip-buying

Solana (SOL) price hovers above $131 at the time of writing on Monday, nearing the upper boundary of a falling wedge pattern, awaiting a decisive breakout.