- AUD/JPY could target the lower boundary of the descending channel after a successful break below the 93.00 level.
- The 14-day RSI is positioned on the 30 mark, signaling an oversold condition and suggesting a potential upward correction.
- The pair could find the primary barrier at the nine-day EMA of 94.46.
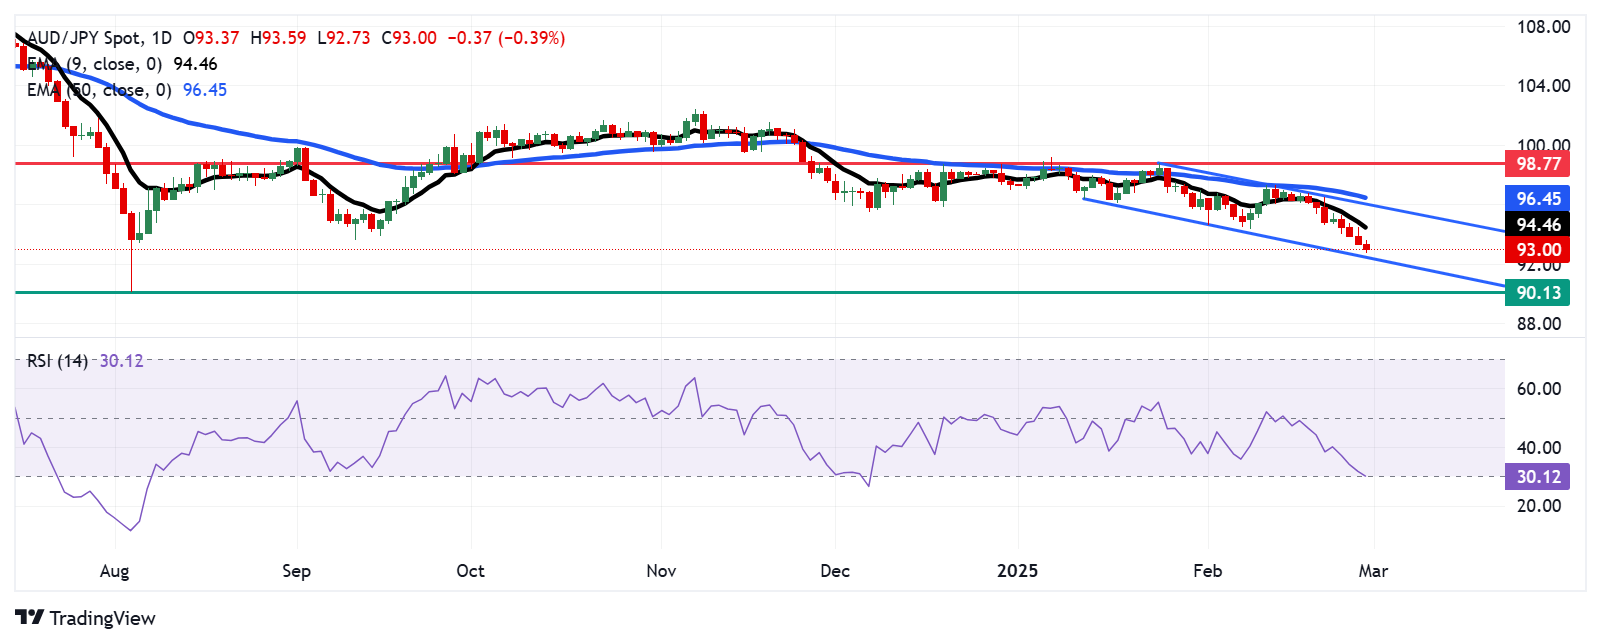
AUD/JPY remains tepid for the fourth successive session, trading around 93.00 during the Asian hours on Friday. A review of the daily chart shows the currency cross moving downwards within a descending channel pattern, indicating the strengthening bearish bias.
The 14-day Relative Strength Index (RSI) sits at the 30 level, signaling an oversold condition and a potential upward correction in the near term. Additionally, the AUD/JPY cross remains below the nine-day Exponential Moving Average (EMA), highlighting weak short-term price momentum.
The AUD/JPY cross tests the immediate support at the 93.00 level, followed by the lower boundary of the descending channel at 92.50. A break below the channel could reinforce the bearish bias and put downward pressure on the currency cross to navigate the region around 90.13, the lowest since May 2023, last seen on August 5, 2024.
On the upside, the AUD/JPY cross could target the primary barrier at the nine-day EMA of 94.46. A break above this level could improve the short-term price momentum and support the pair to approach the upper boundary of the descending channel at the psychological level of 96.00, followed by the 50-day EMA at 96.45.
AUD/JPY: Daily Chart
Australian Dollar PRICE Today
The table below shows the percentage change of Australian Dollar (AUD) against listed major currencies today. Australian Dollar was the weakest against the US Dollar.
USD | EUR | GBP | JPY | CAD | AUD | NZD | CHF | |
---|---|---|---|---|---|---|---|---|
USD | 0.18% | 0.25% | 0.00% | -0.02% | 0.40% | 0.63% | 0.02% | |
EUR | -0.18% | 0.07% | -0.19% | -0.19% | 0.21% | 0.44% | -0.17% | |
GBP | -0.25% | -0.07% | -0.24% | -0.26% | 0.15% | 0.38% | -0.25% | |
JPY | 0.00% | 0.19% | 0.24% | 0.00% | 0.40% | 0.62% | -0.01% | |
CAD | 0.02% | 0.19% | 0.26% | -0.01% | 0.40% | 0.64% | 0.00% | |
AUD | -0.40% | -0.21% | -0.15% | -0.40% | -0.40% | 0.23% | -0.39% | |
NZD | -0.63% | -0.44% | -0.38% | -0.62% | -0.64% | -0.23% | -0.63% | |
CHF | -0.02% | 0.17% | 0.25% | 0.00% | -0.00% | 0.39% | 0.63% |
The heat map shows percentage changes of major currencies against each other. The base currency is picked from the left column, while the quote currency is picked from the top row. For example, if you pick the Australian Dollar from the left column and move along the horizontal line to the US Dollar, the percentage change displayed in the box will represent AUD (base)/USD (quote).
Information on these pages contains forward-looking statements that involve risks and uncertainties. Markets and instruments profiled on this page are for informational purposes only and should not in any way come across as a recommendation to buy or sell in these assets. You should do your own thorough research before making any investment decisions. FXStreet does not in any way guarantee that this information is free from mistakes, errors, or material misstatements. It also does not guarantee that this information is of a timely nature. Investing in Open Markets involves a great deal of risk, including the loss of all or a portion of your investment, as well as emotional distress. All risks, losses and costs associated with investing, including total loss of principal, are your responsibility. The views and opinions expressed in this article are those of the authors and do not necessarily reflect the official policy or position of FXStreet nor its advertisers. The author will not be held responsible for information that is found at the end of links posted on this page.
If not otherwise explicitly mentioned in the body of the article, at the time of writing, the author has no position in any stock mentioned in this article and no business relationship with any company mentioned. The author has not received compensation for writing this article, other than from FXStreet.
FXStreet and the author do not provide personalized recommendations. The author makes no representations as to the accuracy, completeness, or suitability of this information. FXStreet and the author will not be liable for any errors, omissions or any losses, injuries or damages arising from this information and its display or use. Errors and omissions excepted.
The author and FXStreet are not registered investment advisors and nothing in this article is intended to be investment advice.
Recommended content
Editors’ Picks

EUR/USD retreats below 1.0800 ahead of US data
EUR/USD loses traction and trades below 1.0800 on Tuesday. The risk-averse market atmosphere ahead of Wednesday's tariff announcements makes it difficult for the pair to hold its ground as the market attention turns to US data releases.

GBP/USD struggles to stabilize above 1.2900
Following a short-lasting uptick in the European session, GBP/USD edges lower and trades slightly below 1.2900 on Tuesday. The US Dollar (USD) holds its ground as investors adopt a cautious stance in anticipation of data releases and Wednesday's tariff decisions.

Gold pulls away from record highs, holds comfortably above $3,100
Gold corrects lower but manages to hold comfortably above $3,100 after touching a new record-high near $3,150 earlier in the day. Falling US Treasury bond yields help XAU/USD limit its losses as investors refrain from taking large positions ahead of US tariff announcements.

JOLTS job openings set to decline modestly in February
The Job Openings and Labor Turnover Survey (JOLTS) will be released on Tuesday by the United States Bureau of Labor Statistics. Markets expect job openings to decline to 7.63 million on the last business day of February.

Is the US economy headed for a recession?
Leading economists say a recession is more likely than originally expected. With new tariffs set to be launched on April 2, investors and economists are growing more concerned about an economic slowdown or recession.

The Best brokers to trade EUR/USD
SPONSORED Discover the top brokers for trading EUR/USD in 2025. Our list features brokers with competitive spreads, fast execution, and powerful platforms. Whether you're a beginner or an expert, find the right partner to navigate the dynamic Forex market.