AUD/JPY Price Forecast: Rises above 93.50, next barrier appears at nine-day EMA
- AUD/JPY could target the psychological support level at 93.00.
- The 14-day RSI is positioned above the 30 mark, reinforcing the prevailing bearish bias.
- The pair tests the primary barrier at the nine-day EMA of 93.95
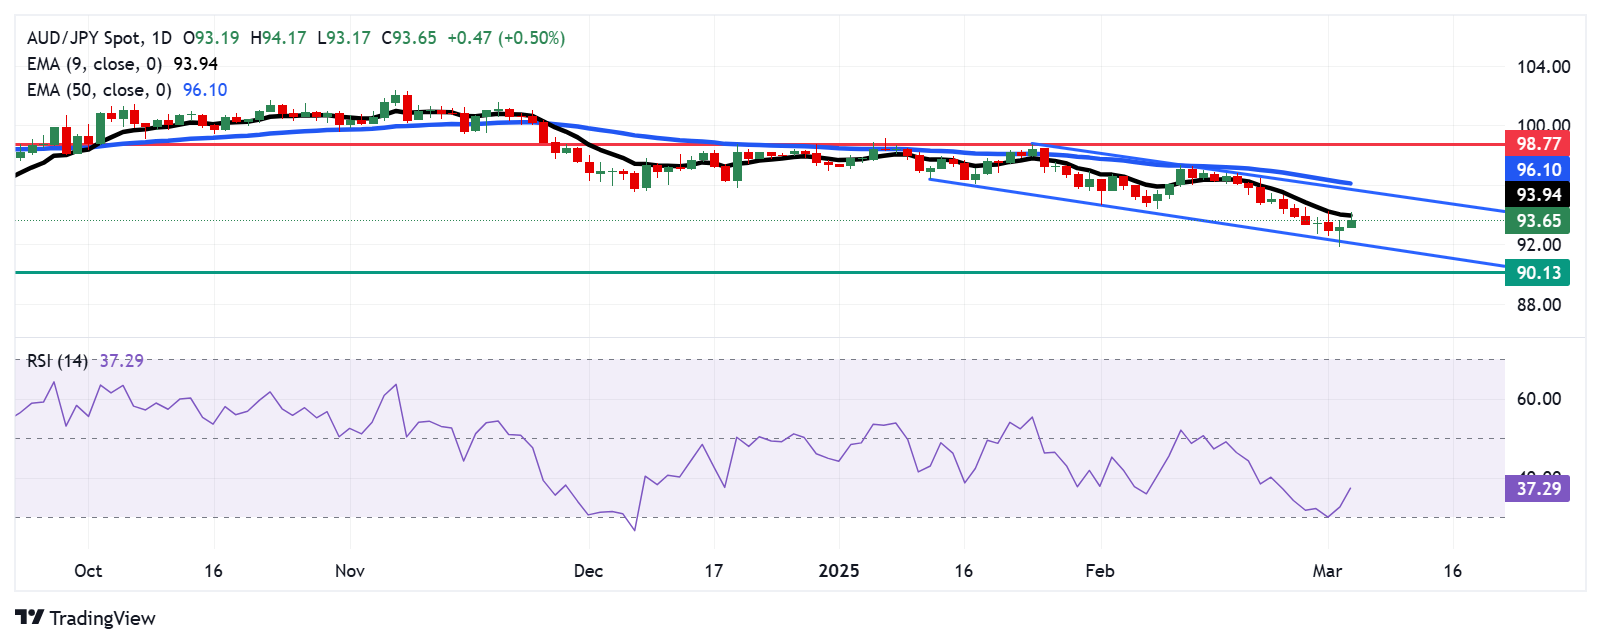
AUD/JPY extends its gains for the second consecutive day, trading around 93.60 during Asian hours on Wednesday. However, a technical review of the daily chart reveals the pair remains within a descending channel, signaling a persistent bearish bias.
The 14-day Relative Strength Index (RSI) remains above the 30 level, reinforcing the prevailing bearish bias. Furthermore, the AUD/JPY cross continues to trade below the nine-day Exponential Moving Average (EMA), indicating weaker short-term price momentum.
The AUD/JPY cross may first test the psychological support level at 93.00, followed by the lower boundary of the descending channel at 92.00. A decisive break below this channel could strengthen the bearish bias, potentially pushing the pair toward the 90.13 region—the lowest level since May 2023, last observed on August 5, 2024.
On the upside, the AUD/JPY cross faces its first resistance at the nine-day EMA of 93.95. A breakout above this level could strengthen short-term price momentum, paving the way for a move toward the upper boundary of the descending channel at the psychological level of 96.00, followed by the 50-day EMA at 96.10.
AUD/JPY: Daily Chart
Japanese Yen PRICE Today
The table below shows the percentage change of Japanese Yen (JPY) against listed major currencies today. Japanese Yen was the strongest against the Swiss Franc.
| USD | EUR | GBP | JPY | CAD | AUD | NZD | CHF | |
|---|---|---|---|---|---|---|---|---|
| USD | -0.12% | -0.05% | 0.48% | -0.33% | 0.01% | 0.02% | 0.19% | |
| EUR | 0.12% | 0.07% | 0.57% | -0.21% | 0.13% | 0.14% | 0.31% | |
| GBP | 0.05% | -0.07% | 0.50% | -0.27% | 0.05% | 0.07% | 0.24% | |
| JPY | -0.48% | -0.57% | -0.50% | -0.80% | -0.46% | -0.46% | -0.28% | |
| CAD | 0.33% | 0.21% | 0.27% | 0.80% | 0.34% | 0.34% | 0.52% | |
| AUD | -0.01% | -0.13% | -0.05% | 0.46% | -0.34% | 0.01% | 0.18% | |
| NZD | -0.02% | -0.14% | -0.07% | 0.46% | -0.34% | -0.01% | 0.18% | |
| CHF | -0.19% | -0.31% | -0.24% | 0.28% | -0.52% | -0.18% | -0.18% |
The heat map shows percentage changes of major currencies against each other. The base currency is picked from the left column, while the quote currency is picked from the top row. For example, if you pick the Japanese Yen from the left column and move along the horizontal line to the US Dollar, the percentage change displayed in the box will represent JPY (base)/USD (quote).
Author

Akhtar Faruqui
FXStreet
Akhtar Faruqui is a Forex Analyst based in New Delhi, India. With a keen eye for market trends and a passion for dissecting complex financial dynamics, he is dedicated to delivering accurate and insightful Forex news and analysis.


