AUD/JPY Price Analysis: Subdued around current levels amid mixed signals from BoJ


  • AUD/JPY trades at 94.22, almost flat as Tuesday's session begins.
  • BoJ Governor Kazuo Ueda hints at the end of negative interest rates, sparking short-lived gains in JPY.
  • Technical indicators suggest a neutral bias, with both buyers and sellers awaiting a fresh catalyst.

The Australian Dollar (AUD) posted minuscule gains on Monday versus the Japanese Yen (JPY), after the Bank of Japan (BoJ) Governor Kazuo Ueda made comments that the end of negative interest rates is possible if data warrants it. Hence, market participants priced in a possible monetary policy normalization as the JPY registered solid gains. Nevertheless, they were short-lived, as shown by the AUD/JPY pair. At the time of writing, the cross trades at 94.22, almost flat, as Tuesday’s session begins.

AUD/JPY Price Analysis: Technical outlook

The daily chart portrays the pair as neutral biased, with no clear bias, as the pair forms a symmetrical triangle preceded by a downtrend. Also, the Senkou Span A and B lines that form the Ichimoku Clous (Kumo) and the Tenkan and Kijun-Sen are flat. That said, neither buyers nor sellers are in charge, awaiting a fresh catalyst that directs the AUD/JPY pair.

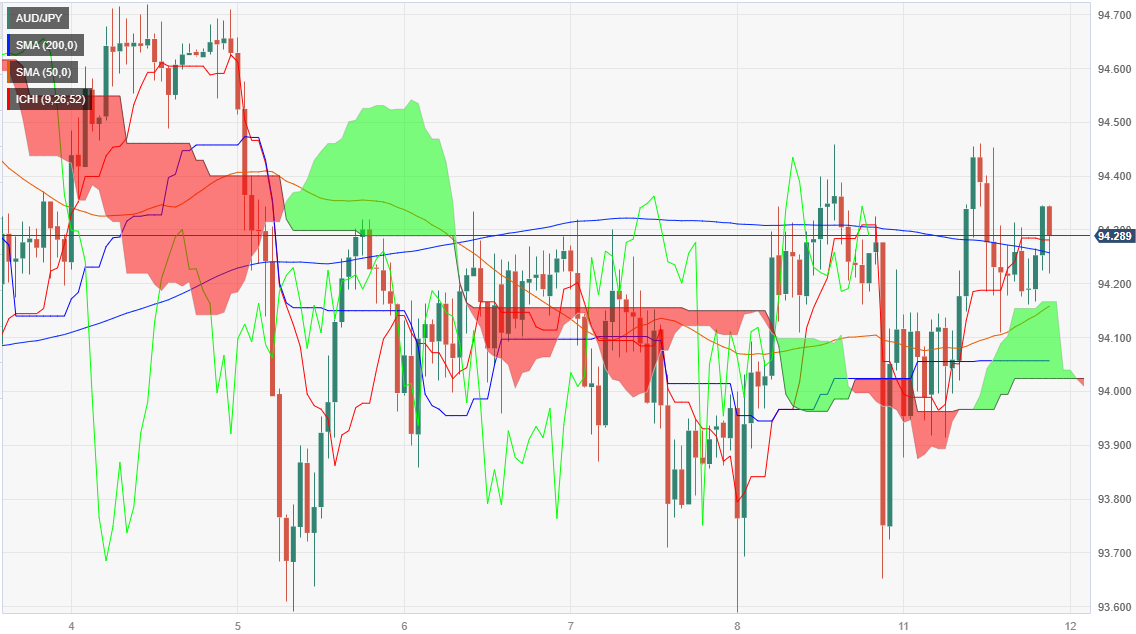
From an hourly chart perspective, the pair finished Monday’s session near the session’s highs, suggesting an upward bias. Hence, the AUD/JPY first resistance would be the September 11 high at 94.45, followed by the September 4 swing high at 94.70, before challenging 95.00. Conversely, the first support would be the top of the Kumo at 94.10, followed by the 94.00 figure. A breach of that area would shift the bias downwards.

AUD/JPY Price Action – Hourly chart

AUD/JPY

Overview
Today last price 94.26
Today Daily Change -0.02
Today Daily Change % -0.02
Today daily open 94.28
 
Trends
Daily SMA20 94.06
Daily SMA50 94.42
Daily SMA100 93.53
Daily SMA200 91.96
 
Levels
Previous Daily High 94.46
Previous Daily Low 93.59
Previous Weekly High 94.72
Previous Weekly Low 93.59
Previous Monthly High 95.81
Previous Monthly Low 92.79
Daily Fibonacci 38.2% 94.13
Daily Fibonacci 61.8% 93.92
Daily Pivot Point S1 93.76
Daily Pivot Point S2 93.24
Daily Pivot Point S3 92.89
Daily Pivot Point R1 94.63
Daily Pivot Point R2 94.98
Daily Pivot Point R3 95.49


Share: Feed news

Information on these pages contains forward-looking statements that involve risks and uncertainties. Markets and instruments profiled on this page are for informational purposes only and should not in any way come across as a recommendation to buy or sell in these assets. You should do your own thorough research before making any investment decisions. FXStreet does not in any way guarantee that this information is free from mistakes, errors, or material misstatements. It also does not guarantee that this information is of a timely nature. Investing in Open Markets involves a great deal of risk, including the loss of all or a portion of your investment, as well as emotional distress. All risks, losses and costs associated with investing, including total loss of principal, are your responsibility. The views and opinions expressed in this article are those of the authors and do not necessarily reflect the official policy or position of FXStreet nor its advertisers. The author will not be held responsible for information that is found at the end of links posted on this page.

If not otherwise explicitly mentioned in the body of the article, at the time of writing, the author has no position in any stock mentioned in this article and no business relationship with any company mentioned. The author has not received compensation for writing this article, other than from FXStreet.

FXStreet and the author do not provide personalized recommendations. The author makes no representations as to the accuracy, completeness, or suitability of this information. FXStreet and the author will not be liable for any errors, omissions or any losses, injuries or damages arising from this information and its display or use. Errors and omissions excepted.

The author and FXStreet are not registered investment advisors and nothing in this article is intended to be investment advice.

XM
Account
7.2
Tools
9.2
Service
9.4
Trading
9.0
Trust
7.0
Experience
8.4
Read review
Moneta Markets
Account
7.4
Tools
6.6
Service
8.0
Trading
6.6
Trust
5.2
Experience
9.2
Read review
Trading Pro
Account
7.2
Tools
5.2
Service
6.6
Trading
8.0
Trust
5.0
Experience
7.0
Read review
Pepperstone
Account
8.2
Tools
8.2
Service
7.4
Trading
9.0
Trust
8.8
Experience
9.0
Read review
XM
Read review
Moneta Markets
Read review
Trading Pro
Read review
Pepperstone
Read review
Trading Pro
Read review
Pepperstone
Read review
XM
Read review
Moneta Markets
Read review
Trading Pro
Account
7.2
Tools
5.2
Service
6.6
Trading
8.0
Trust
5.0
Experience
7.0
Read review
Pepperstone
Account
8.2
Tools
8.2
Service
7.4
Trading
9.0
Trust
8.8
Experience
9.0
Read review
XM
Account
7.2
Tools
9.2
Service
9.4
Trading
9.0
Trust
7.0
Experience
8.4
Read review
Moneta Markets
Account
7.4
Tools
6.6
Service
8.0
Trading
6.6
Trust
5.2
Experience
9.2
Read review

Recommended content


Recommended content

Editors’ Picks

EUR/USD retreats to 1.0950 area as safe-haven flows dominate markets

EUR/USD retreats to 1.0950 area as safe-haven flows dominate markets

EUR/USD loses its traction and declines to the 1.0950 area following a recovery attempt earlier in the day. The risk-averse market atmosphere makes it difficult for the pair to hold its ground as investors grow increasingly concerned over a deepening trade war weighing on global economic activity.

EUR/USD News
GBP/USD drops to fresh monthly low, tests 1.2800

GBP/USD drops to fresh monthly low, tests 1.2800

GBP/USD stays under persistent bearish pressure in the European session on Monday and trades at its lowest level in a month near 1.2800. The intense flight-to-safety remains the main market theme after US President Donald Trump's tariffs triggered a global trade war last week.

GBP/USD News
Gold price holds above $3,000 amid a global meltdown; bulls seem non-committed

Gold price holds above $3,000 amid a global meltdown; bulls seem non-committed

Gold price attracts some sellers near the $3,055 support-turned-resistance and stalls its intraday recovery from the $2,972-2,971 area, or a nearly four-week low touched earlier this Monday. Investors continue to unwind their bullish positions to cover losses from a broader meltdown across the global financial markets

Gold News
Solana Price Forecast: Bears gain momentum as SOL falls below $100

Solana Price Forecast: Bears gain momentum as SOL falls below $100

Solana (SOL) extends its loss by over 7% and falls below the $100 mark at the time of writing on Monday after crashing 15.15% last week. Coinglass data shows that SOL’s leveraged traders wiped out nearly $70 million in liquidations in the last 24 hours.

Read more
Strategic implications of “Liberation Day”

Strategic implications of “Liberation Day”

Liberation Day in the United States came with extremely protectionist and inward-looking tariff policy aimed at just about all U.S. trading partners. In this report, we outline some of the more strategic implications of Liberation Day and developments we will be paying close attention to going forward.

Read more
The Best brokers to trade EUR/USD

The Best brokers to trade EUR/USD

SPONSORED Discover the top brokers for trading EUR/USD in 2025. Our list features brokers with competitive spreads, fast execution, and powerful platforms. Whether you're a beginner or an expert, find the right partner to navigate the dynamic Forex market.

Read More

Forex MAJORS

Cryptocurrencies

Signatures

Best Brokers of 2025