• AUD/JPY down 0.10%, trading at 93.67, influenced by China’s economic woes and US interest rate concerns.
  • Technical indicators show resistance at 93.82, with further downside possible if the pair falls below last week’s low of 92.78.
  • Intraday outlook is bearish, with key resistance at 93.75; a break below 93.50 could trigger further declines.

The AUD/JPY trimmed some of Monday’s gains, post losses of 0.10% on Tuesday, though it opens Wednesday’s Asian session with a lower not, exchanging hands at 93.67, down a minuscule 0.01%, at the time of writing. The main drivers for the AUD/JPY fall are risk aversion on China’s woes, US banks feeling the pain of higher interest rates and uncertainty about the US Federal Reserve Chair Powell’s speech at the Jackson Hole Symposium.

AUD/JPY Price Analysis: Technical outlook

The AUD/JPY daily chart portrays the pair continuing its downtrend as the cross-currency pair fell below the Ichimoku Cloud (Kumo). Also, the confluence of the Tenkan and Kijun-Sen lines, at around 93.82, would cap buyers’ intentions of reclaiming the 94.00 figure. Further downside is warranted once the AUD/JPY dives below the last week’s low of 92.78, with the 92.00 psychological level up next, followed by the July 28 low of 91.79.

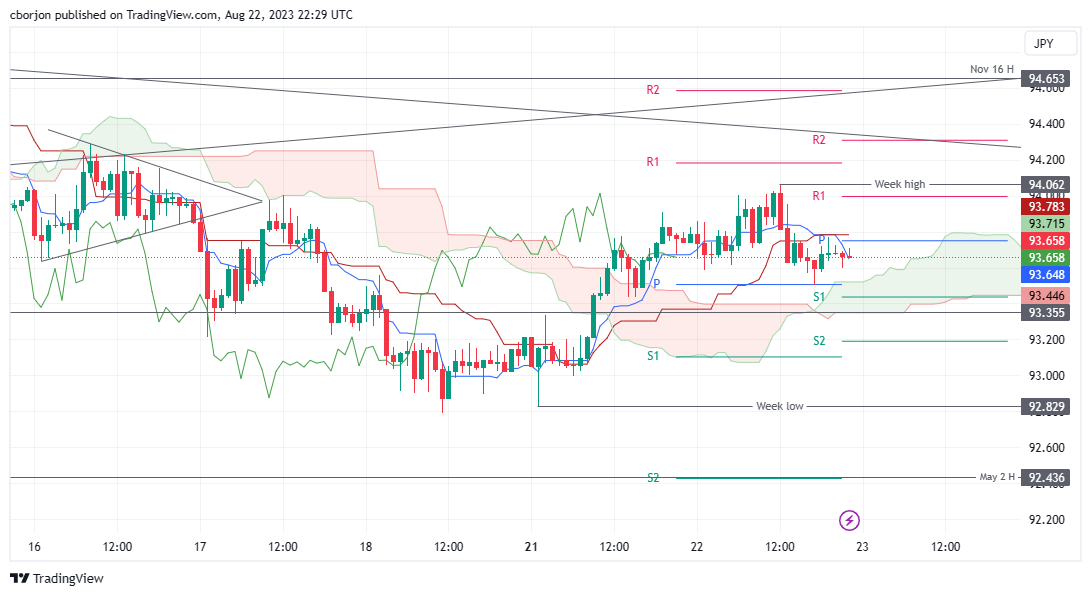
From an intraday perspective, the AUD/JPY is set to extend its gains, as Monday’s price action lifted the exchange rates from below 92.89, with the pair reaching a week high of 94.06. Buyers’ failure to hold prices above 94.00 exacerbated AUD/JPY’s fall toward the top of the Kumo, with prices bouncing off the day’s low. It should be said that Tenkan and Kijun-Sen portray the pair as bearish, with the latter sitting on top of the former, and intersecting with the daily pivot point at 93.75, seen as a first resistance level. A breach of that level will expose the R1 pivot point at the 94.00 mark.

Conversely, a break below Tuesday’s low of 93.50 could put into play the bottom of the Kumo at 93.30, followed by the S2 pivot level at 93.19, and then the current week’s low of 92.83.

AUD/JPY Price Action – Hourly chart

AUD/JPY

Overview
Today last price 93.69
Today Daily Change -0.10
Today Daily Change % -0.11
Today daily open 93.79
 
Trends
Daily SMA20 94.05
Daily SMA50 94.98
Daily SMA100 92.85
Daily SMA200 91.91
 
Levels
Previous Daily High 93.91
Previous Daily Low 92.83
Previous Weekly High 94.87
Previous Weekly Low 92.79
Previous Monthly High 96.84
Previous Monthly Low 91.79
Daily Fibonacci 38.2% 93.5
Daily Fibonacci 61.8% 93.24
Daily Pivot Point S1 93.11
Daily Pivot Point S2 92.43
Daily Pivot Point S3 92.03
Daily Pivot Point R1 94.19
Daily Pivot Point R2 94.59
Daily Pivot Point R3 95.27


Share: Feed news

Information on these pages contains forward-looking statements that involve risks and uncertainties. Markets and instruments profiled on this page are for informational purposes only and should not in any way come across as a recommendation to buy or sell in these assets. You should do your own thorough research before making any investment decisions. FXStreet does not in any way guarantee that this information is free from mistakes, errors, or material misstatements. It also does not guarantee that this information is of a timely nature. Investing in Open Markets involves a great deal of risk, including the loss of all or a portion of your investment, as well as emotional distress. All risks, losses and costs associated with investing, including total loss of principal, are your responsibility. The views and opinions expressed in this article are those of the authors and do not necessarily reflect the official policy or position of FXStreet nor its advertisers. The author will not be held responsible for information that is found at the end of links posted on this page.

If not otherwise explicitly mentioned in the body of the article, at the time of writing, the author has no position in any stock mentioned in this article and no business relationship with any company mentioned. The author has not received compensation for writing this article, other than from FXStreet.

FXStreet and the author do not provide personalized recommendations. The author makes no representations as to the accuracy, completeness, or suitability of this information. FXStreet and the author will not be liable for any errors, omissions or any losses, injuries or damages arising from this information and its display or use. Errors and omissions excepted.

The author and FXStreet are not registered investment advisors and nothing in this article is intended to be investment advice.

Recommended content


Recommended content

Editors’ Picks

AUD/USD finally broke above 0.6700… will it last?

AUD/USD finally broke above 0.6700… will it last?

AUD/USD added to Tuesday’s advance and rose markedly in a context favourable to the risk-associated space following the sharp data-driven sell-off in the Greenback, while auspicious results from the domestic calendar also lent legs to AUD.

AUD/USD News

EUR/USD: Bullish outlook expected above the 200-day SMA

EUR/USD: Bullish outlook expected above the 200-day SMA

EUR/USD extended its multi-session recovery north of 1.0800 the figure following the persistent retracement in the US Dollar and against the backdrop of steady expectation ahead of the second round of French elections on July 7.

EUR/USD News

Gold reaches $2,360 on broad USD weakness

Gold reaches $2,360 on broad USD weakness

Gold gathers bullish momentum and trades at its highest level in nearly two weeks above $2,360. Following the disappointing ADP Employment Change and ISM Services PMI data from the US, the 10-year US yield declines sharply, helping XAU/USD extend its daily rally.

Gold News

Ripple legal battle underway as on-chain metrics turn bullish, XRP eyes recovery to $0.50

Ripple legal battle underway as on-chain metrics turn bullish, XRP eyes recovery to $0.50

Ripple made a comeback above $0.48 on Tuesday and hovers above that level in Wednesday’s European session. Ripple on-chain metrics such as transaction volume and Network Realized Profit/Loss (NPL) have turned bullish, supporting a recovery in the altcoin. 

Read more

Disinflation in the United States: The scale of the sacrifice on the labour market

Disinflation in the United States: The scale of the sacrifice on the labour market

Since a 1977 act, the dual mandate of the Federal Reserve (Fed) has de jure entrusted it with the objectives of maximum employment and price stability (the latter being expected to favour the former in the long term).

Read more

Forex MAJORS

Cryptocurrencies

Signatures