|

AUD/JPY Price Analysis: Sellers step in within a rising wedge and break the 20-EMA, eyeing 92.50

  • AUD/JPY plummeted by 270 pips in two days and is losing in the week 0.54%.
  • Worldwide S&P Global PMIs spurred global recession fears, as all missed estimations.
  • AUD/JPY Price Analysis: It is still upward biased, but the price is closing to the bottom of a rising wedge which, once broken, may send the pair towards 85.00.

The AUD/JPY plunged on Thursday for the second straight day, diving 1.39%, reaching on its way south a daily low near 92.64, though on Friday, as the Asian session began, AUD/JPY buyers reclaimed the 93.00 mark. At the time of writing, the AUD/JPY is trading at 93.10.

The market sentiment seesawed throughout Thursday’s session. Meanwhile, Asian equity futures follows Thursday’s Wall Street mood, climbing between 0.05% and 1%. Dismal S&P Global PMIs reported from the Eurozone, the UK, and the US, threaten to derail growth, with readings accelerating towards the 50 midline, which, broken to the downside, depicts that the economy is entering a contraction phase.

AUD/JPY Price Analysis: Technical outlook

Daily chart

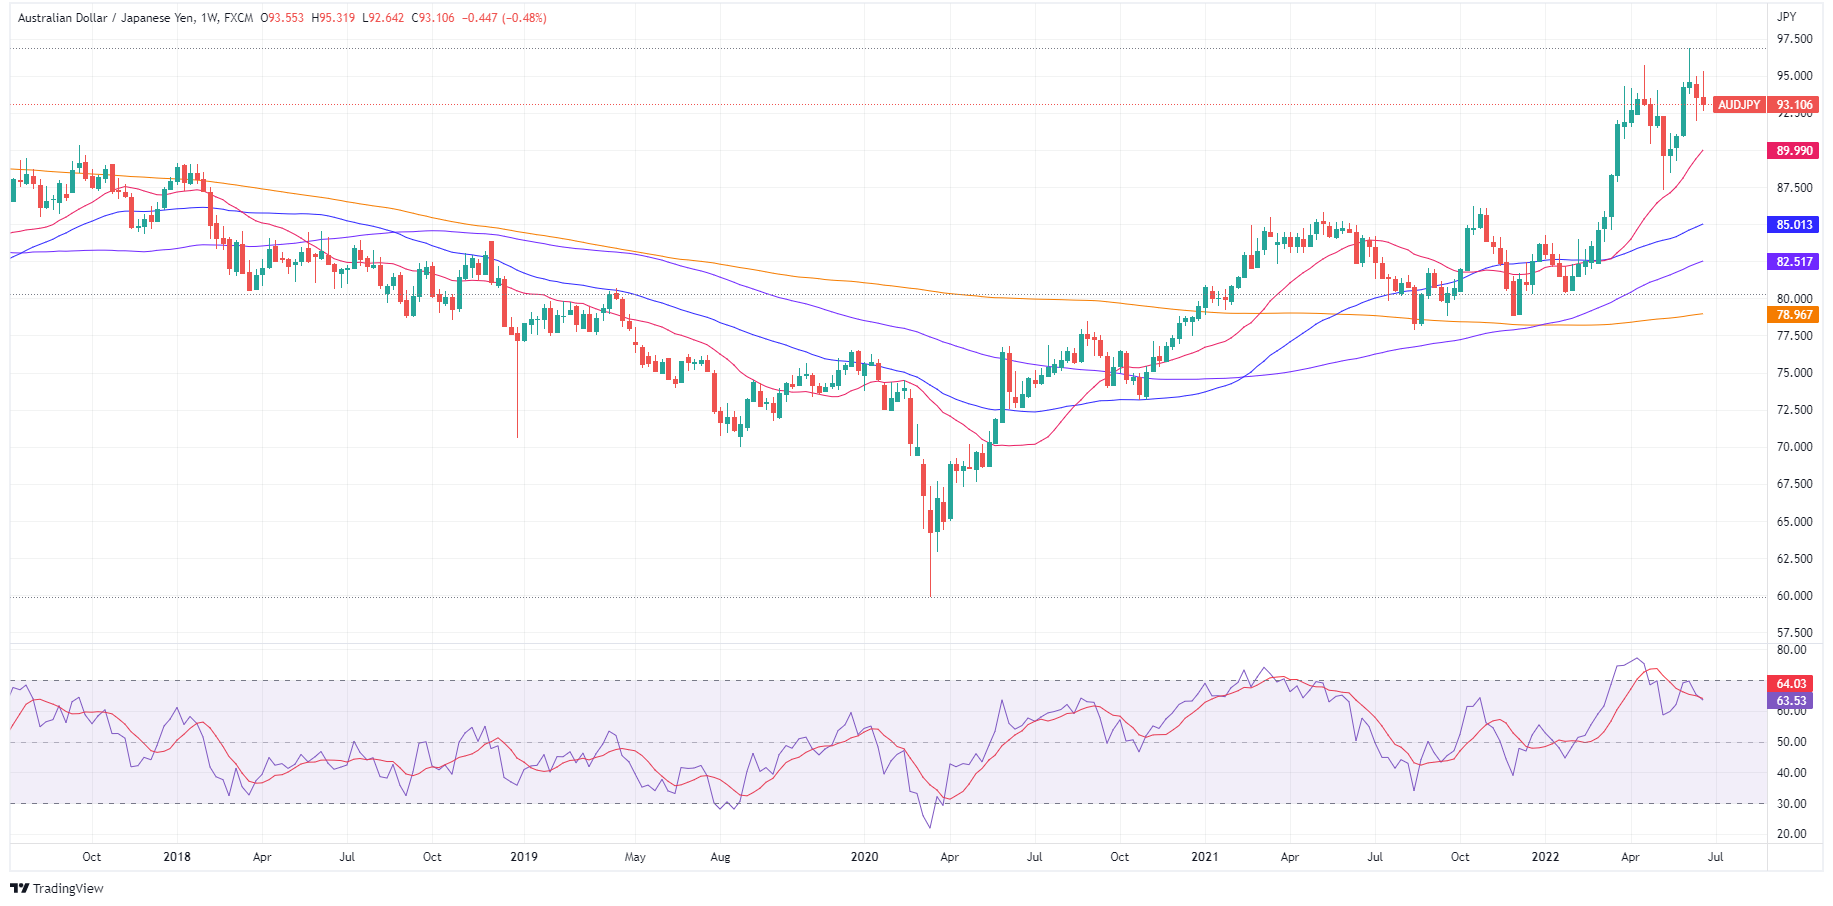
From a technical perspective, the AUD/JPY remains upward biased but under selling pressure. Price action in the last couple of days witnessed a 270 pip fall, from around weekly highs near 95.28, towards 92.64, June 23 lows.

It’s worth noting that AUD/JPY’s price is closing towards the rising wedge bottom trendline, meaning a break below would send the cross towards 85.00. However, on its way south, the AUD/JPY will need to breach crucial supports on its way south.

Therefore, if the above scenario plays out, the AUD/JPY first support would be the 50-day exponential moving average (EMA) at 92.44. Break below would send the cross aiming towards the 100-EMA at 89.83, followed by a fall to the 200-EMA at 86.13.

AUD/JPY Key Technical Levels


Overview
Today last price93.10
Today Daily Change-1.29
Today Daily Change %-1.37
Today daily open94.39
 
Trends
Daily SMA2093.76
Daily SMA5092.51
Daily SMA10089.64
Daily SMA20086.05
 
Levels
Previous Daily High95.32
Previous Daily Low93.59
Previous Weekly High94.99
Previous Weekly Low91.97
Previous Monthly High94.03
Previous Monthly Low87.31
Daily Fibonacci 38.2%94.25
Daily Fibonacci 61.8%94.66
Daily Pivot Point S193.55
Daily Pivot Point S292.71
Daily Pivot Point S391.83
Daily Pivot Point R195.27
Daily Pivot Point R296.16
Daily Pivot Point R397

Author

Christian Borjon Valencia

Markets analyst, news editor, and trading instructor with over 14 years of experience across FX, commodities, US equity indices, and global macro markets.

More from Christian Borjon Valencia
Share:

Editor's Picks

EUR/USD appears supported by the 200-day SMA, for now

Following an early pullback to multi-week lows near 1.1670, EUR/USD now manages to reclaim the 1.1700 region as the NA session draws to a close on Monday. The steep retracement in spot follows the equally strong move higher in the US Dollar, as investors continue to assess the geopolitical landscape in the wake of the US and Israel attacks on Iran.


GBP/USD hits new yearly lows near 1.3300

GBP/USD adds to the recent bearish tone, approaching to the key 1.3300 support to reach fresh YTD troughs against the backdrop of the robust performance of the US Dollar. Indeed, Cable’s decline comes amid the firm demand for the safe-haven space in the wake of the US and Israel attacks to Iran.

Gold clings to gains as US-Iran conflict continues to underpin safe-haven assets

Gold retains positive bias for the fifth consecutive day on Tuesday as rising geopolitical tensions in the Middle East continue to underpin safe-haven assets. However, a bullish US Dollar could keep the bullion below its highest level since late January, set on Monday, warranting caution before positioning for any further appreciation.

Strategy lifts holdings to 3.4% of Bitcoin's total supply amid inflows into crypto products

Strategy continued its accumulation of the top crypto last week, acquiring 3,015 BTC for $204 million amid renewed interest in crypto products after four weeks of outflows.

The Fed is finally talking about AI – Here's why it matters for the US Dollar

AI is moving from earnings calls into the heart of monetary policy discussions, forcing Federal Reserve officials to confront a new question: How to act if AI reshapes inflation, employment and interest rates at the same time?

Grass 20% bullish breakout defies broader market weakness

Grass (GRASS) is edging up above $0.30 at the time of writing on Monday. The token’s notable 20% intraday surge stands out amid heightened volatility in the broader crypto market.