AUD/JPY Price Analysis: Remains capped below the 94.00 barrier
- AUD/JPY holds below the 94.00 barrier on Monday following the BoJ offering unlimited JGBs at a fixed rate.
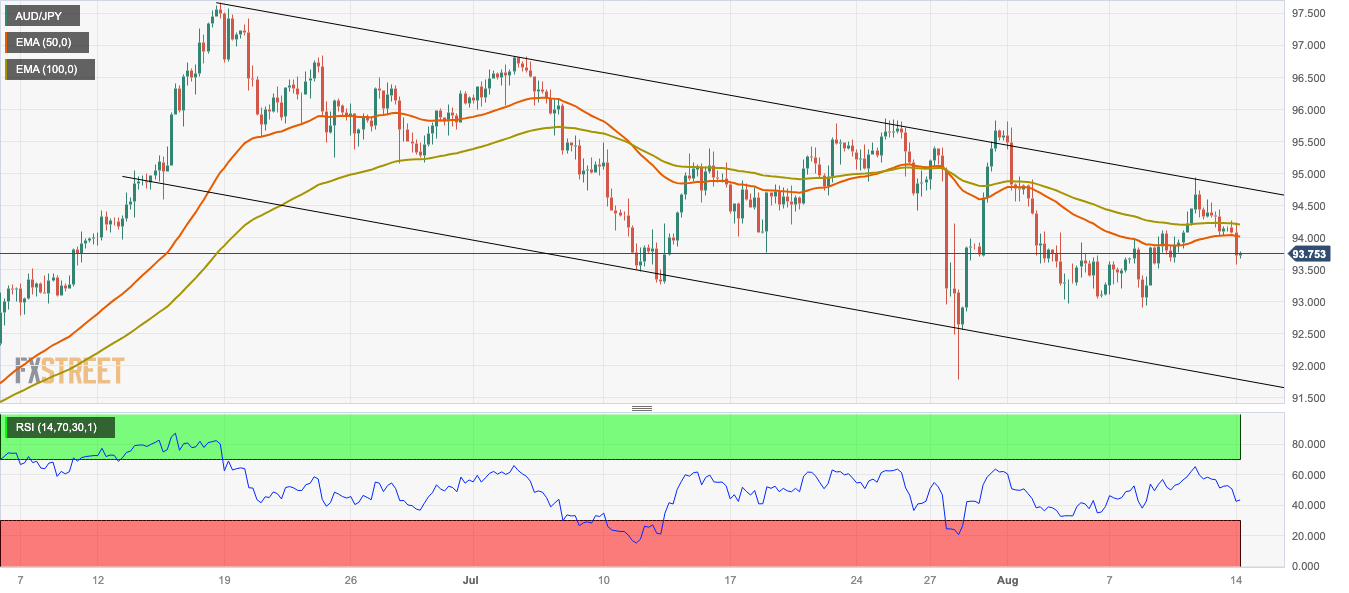
- AUD/JPY trades within a descending trend channel line from the middle of June on the four-hour chart.
- The immediate resistance level for AUD/JPY is seen at 94.00; the key contention level is located at 93.00.

The AUD/JPY cross loses traction and remains capped below the 94.00 barrier on Monday. Earlier in the day, the Bank of Japan (BoJ) offers unlimited Japanese Government Bonds (JGBs) with a residual maturity of 5 to 10 years at a fixed rate. Following the data, AUD/JPY edges lower to 93.57 and rebounded to the 93.75 mark in the Asian session.
From a technical perspective, AUD/JPY trades within a descending trend channel line from the middle of June on the four-hour chart. That said, the path of least resistance for the AUD/JPY is to the downside as the cross holds below the 50- and 100-hour Exponential Moving Averages (EMAs).
The immediate resistance level for AUD/JPY is seen at 94.00 (the 50-hour EMA, a psychological round mark). The next barrier to watch is 94.20 (the 100-hour EMA), en route to 94.80 ((the upper boundary of a descending trend channel). Any meaningful follow-through buying above the latter will see a rally to 95.40 (high of July 14).
On the downside, the cross will meet the key contention level at 93.00, representing a psychological round figure, a low of August 4. The next downside stop appears at 92.50 (low of July 18), followed by 92.15 (low of June 6). A breach of the latter will see a drop to 91.80 (the lower limit of a descending trend channel).
It’s worth noting that the Relative Strength Index (RSI) holds in bearish territory below 50, supporting the sellers for now.
AUD/JPY four-hour chart
Author

Lallalit Srijandorn
FXStreet
Lallalit Srijandorn is a Parisian at heart. She has lived in France since 2019 and now becomes a digital entrepreneur based in Paris and Bangkok.


