AUD/JPY Price Analysis: Hits new YTD high above 95.00 as oscillators hint overbought conditions
- AUD/JPY is currently trading in the 94.80s, having hit a YTD high of 95.05
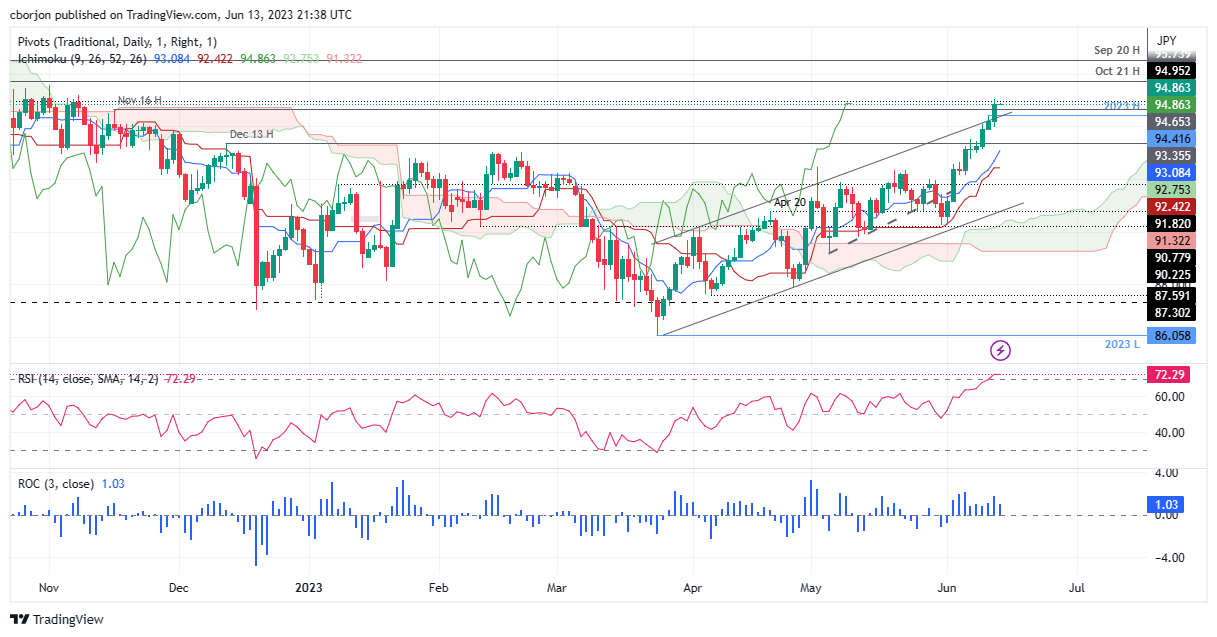
- On the upside, the AUD/JPY October 21 high at 95.74 and September 20 high at 96.54 serve as key resistance points.
- On the downside, if AUD/JPY falls below 94.00 would open the way toward the December 13 high at 93.35 and the Tenkan-Sen line at 93.08.

AUD/JPY rallies past the previous year-to-date (YTD) high of 94.41 and pierces the 95.00 figure to reach a new YTD high, though retraced somewhat, meandering at around 94.80s, after hitting a low of 93.97.
AUD/JPY Price Analysis: Technical outlook
AUD/JPY is set to extend its uptrend after printing a new year-to-date (YTD) high at 95.05. However, oscillators like the Relative Strength Index (RSI) indicator portray the AUD/JPY as overbought. Of note, the AUD/JPY might consolidate above the November 16 high at 94.65 and the 95.00 figure, ahead of the Federal Reserve’s (Fed) decision, which is set to spark volatility in the financial markets.
If AUD/JPY climbs above 95.00, the next resistance would be the October 21 high at 95.74 before challenging the 96.00 figure. Once cleared, next would be the September 20 high at 96.54, before the AUD/JPY tests at 97.00.
Conversely, if AUD/JPY drops below 94.00, it would pave the way toward the December 13 high at 93.35, followed by the Tenkan-Sen line at 93.08.
AUD/JPY Price Action – Daily chart
Author

Christian Borjon Valencia
FXStreet
Markets analyst, news editor, and trading instructor with over 14 years of experience across FX, commodities, US equity indices, and global macro markets.


