AUD/JPY Price Analysis: Corrects upwards, but downside risks remain around 61.8 Fibonacci level


  • AUD/JPY pair sees two straight days of losses as sellers remain in charge.
  • A breach of 20-day EMA support at 88.81 opens the path for further decline.

AUD/JPY Price Action

With the AUD/JPY pair extending its losses to two-straight days and breaching the 20-day Exponential Moving Average (EMA) support at 88.81 has opened the path for sellers. After testing previous resistance at around 90.00, where a prior support trendline turned resistance, sellers gathered momentum, and since then, the AUD/JPY has dropped 2.86%.

Oscillators remain in bearish territory, with the Relative Strength Index (RSI) aiming lower, while the Rate of Change (RoC) portrays sellers remaining in charge.

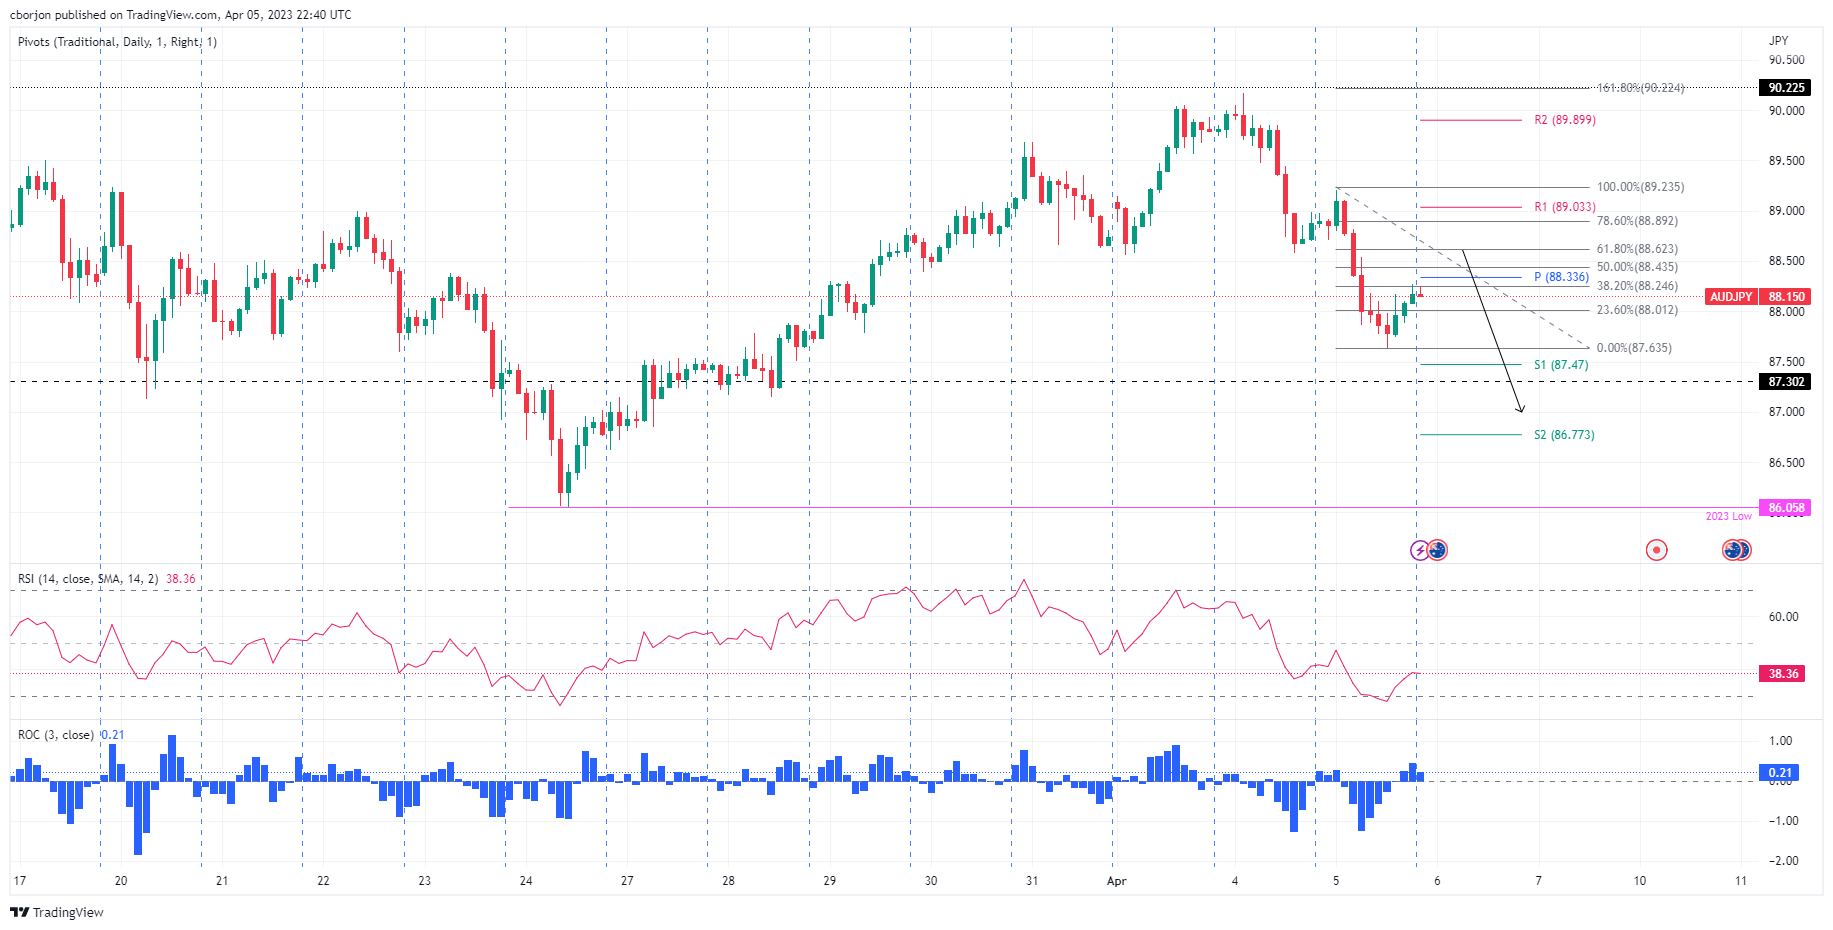
In the short term, the AUD/JPY 1-hour chart portrays the pair correcting upwards, testing the 38.2% Fibonacci retracement around 88.24. Upside risks lie at the central pivot point at 88.33, which, once cleared, would expose the R1 daily pivot at 89.03. Nevertheless, the confluence of April’s 5 low and the 61.80% Fibonacci retracement at around 88.62 would cap any rallies. If AUD/JPY retreats at the latter, look for a slide toward the S2 daily pivot point at 86.77.

AUD/JPY 1-Hour Chart

AUD/JPY Hourly chart

AUD/JPY Technical Levels

AUD/JPY

Overview
Today last price 88.18
Today Daily Change -0.74
Today Daily Change % -0.83
Today daily open 88.92
 
Trends
Daily SMA20 88.63
Daily SMA50 90.54
Daily SMA100 90.91
Daily SMA200 92.58
 
Levels
Previous Daily High 90.17
Previous Daily Low 88.58
Previous Weekly High 89.68
Previous Weekly Low 86.67
Previous Monthly High 92.25
Previous Monthly Low 86.06
Daily Fibonacci 38.2% 89.19
Daily Fibonacci 61.8% 89.56
Daily Pivot Point S1 88.28
Daily Pivot Point S2 87.64
Daily Pivot Point S3 86.69
Daily Pivot Point R1 89.86
Daily Pivot Point R2 90.81
Daily Pivot Point R3 91.45


Share: Feed news

Information on these pages contains forward-looking statements that involve risks and uncertainties. Markets and instruments profiled on this page are for informational purposes only and should not in any way come across as a recommendation to buy or sell in these assets. You should do your own thorough research before making any investment decisions. FXStreet does not in any way guarantee that this information is free from mistakes, errors, or material misstatements. It also does not guarantee that this information is of a timely nature. Investing in Open Markets involves a great deal of risk, including the loss of all or a portion of your investment, as well as emotional distress. All risks, losses and costs associated with investing, including total loss of principal, are your responsibility. The views and opinions expressed in this article are those of the authors and do not necessarily reflect the official policy or position of FXStreet nor its advertisers. The author will not be held responsible for information that is found at the end of links posted on this page.

If not otherwise explicitly mentioned in the body of the article, at the time of writing, the author has no position in any stock mentioned in this article and no business relationship with any company mentioned. The author has not received compensation for writing this article, other than from FXStreet.

FXStreet and the author do not provide personalized recommendations. The author makes no representations as to the accuracy, completeness, or suitability of this information. FXStreet and the author will not be liable for any errors, omissions or any losses, injuries or damages arising from this information and its display or use. Errors and omissions excepted.

The author and FXStreet are not registered investment advisors and nothing in this article is intended to be investment advice.

Recommended content


Recommended content

Editors’ Picks

EUR/USD climbs above 1.0900, looks to post weekly gains

EUR/USD climbs above 1.0900, looks to post weekly gains

EUR/USD gathers bullish momentum and trades above 1.0900 in the American session on Friday, looking to end the week in positive territory. The US Dollar remains under strong selling pressure following the disappointing jobs data, helping the pair push higher.

EUR/USD News

GBP/USD clings to daily gains near 1.2800 after weak US jobs data

GBP/USD clings to daily gains near 1.2800 after weak US jobs data

GBP/USD clings to daily gains at around 1.2800 in the second half of the day on Friday. Nonfarm Payrolls in the US rose by 114,000 in July. This reading missed the market expectation of 175,000 by a wide margin and triggered a USD selloff.

GBP/USD News

Gold pulls away from daily highs, holds above $2,420

Gold pulls away from daily highs, holds above $2,420

After coming within a touching distance of a new all-time high near $2,480 with the immediate reaction to disappointing US labor market data on Friday, Gold reversed its direction and declined below $2,420. Profit-taking ahead of the weekend might be weighing on XAU/USD.

Gold News

Bitcoin bounces off from the ascending trendline

Bitcoin bounces off from the ascending trendline

Bitcoin and Ethereum have retested their key support levels, with a break below these levels potentially signaling a bearish trend ahead. At the same time, Ripple shows resilience and could rally in the coming days after testing its key support level.

Read more

Week ahead – RBA and BoJ summary of opinions take center stage

Week ahead – RBA and BoJ summary of opinions take center stage

RBA decides on policy as hike bets disappear. BoJ Summary of Opinions awaited for more hike hints. After Fed, Dollar turns to ISM non-manufacturing PMI. New Zealand and Canada jobs data also on tap.

Read more

Forex MAJORS

Cryptocurrencies

Signatures