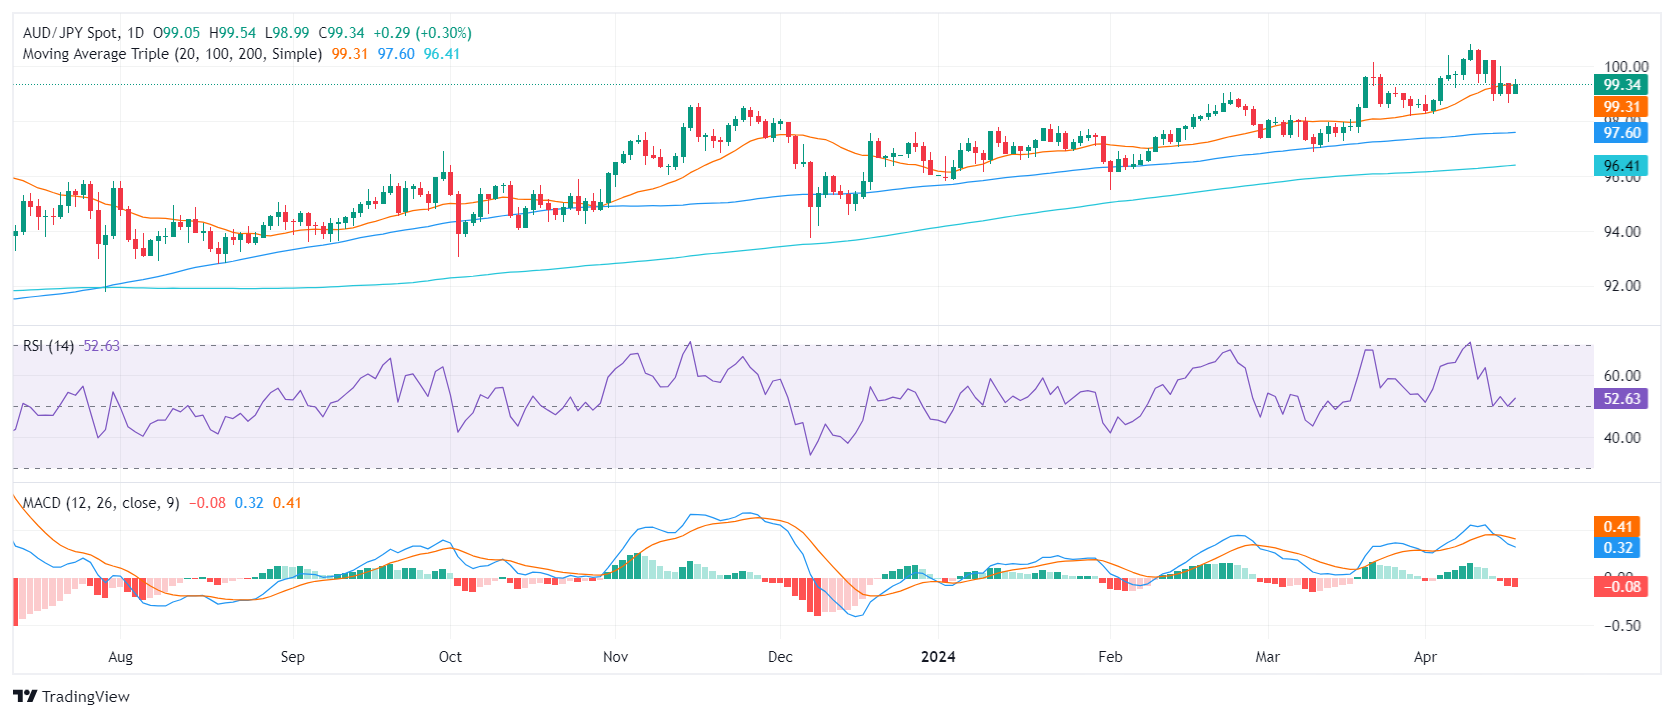
- The daily RSI for the AUD/JPY demonstrates a modest uptrend, maintaining above the middle ground.
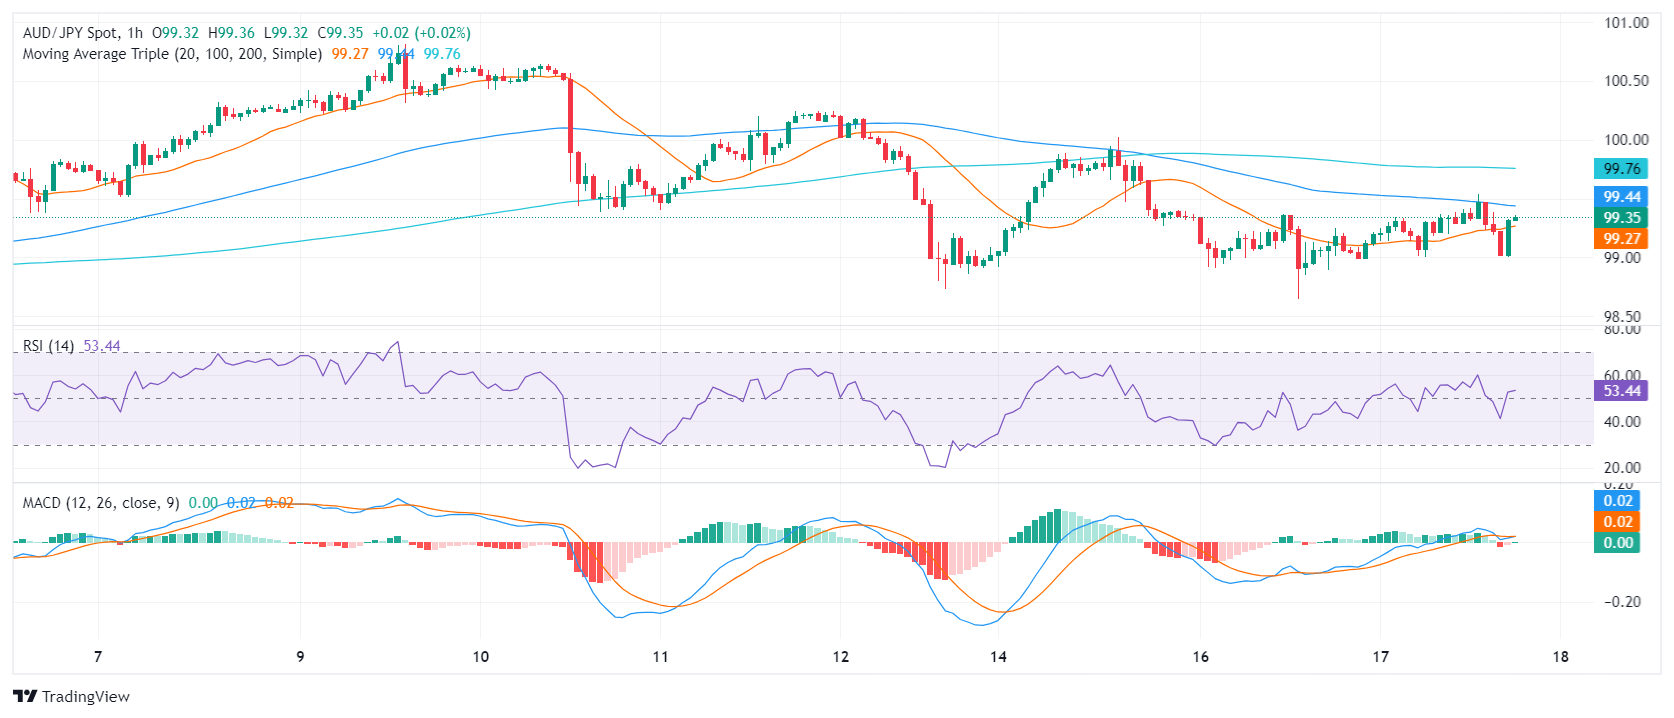
- The Hourly chart reveals mixed sentiment, with frequent RSI changes and negative momentum portrayed by the MACD bars.
- The 20-day SMA at 99.30 is the main target for the bulls.
The AUD/JPY showed a stronger stance by posting a gain of 0.27% and settling at 99.24 in Wednesday’s session. Despite the recent downside, the pair indicates a dominant bullish outlook, firmly standing above the key Simple Moving Averages (SMAs). However, the recent dip below the 20-day SMA brightened the outlook for the bears for the short term.
On the daily chart, the Relative Strength Index (RSI) pair indicates a slight positive trend. Despite dipping close to the 50 level, it recovered and retained its position in positive territory, hovering around 52. Meanwhile, the Moving Average Convergence Divergence (MACD) shows rising red bars, signaling a potential shift in momentum.
AUD/JPY daily chart

The hourly RSI reveals a mixed trend. The latest reading was 53, indicating a positive trend, while previous readings varied between positive and negative territories, revealing fluctuating market momentum. The hourly MACD shows flat red bars, signifying a steady negative momentum.
AUD/JPY hourly chart

Observing the broader prospect, the AUD/JPY's position above the 100-day and 200-day SMA reveals a robust long-term bullish trend. Any significant movements today that keep the cross above these levels won’t threaten the positive outlook, but as the bears gather momentum, some downside in the short term should be expected.
Information on these pages contains forward-looking statements that involve risks and uncertainties. Markets and instruments profiled on this page are for informational purposes only and should not in any way come across as a recommendation to buy or sell in these assets. You should do your own thorough research before making any investment decisions. FXStreet does not in any way guarantee that this information is free from mistakes, errors, or material misstatements. It also does not guarantee that this information is of a timely nature. Investing in Open Markets involves a great deal of risk, including the loss of all or a portion of your investment, as well as emotional distress. All risks, losses and costs associated with investing, including total loss of principal, are your responsibility. The views and opinions expressed in this article are those of the authors and do not necessarily reflect the official policy or position of FXStreet nor its advertisers. The author will not be held responsible for information that is found at the end of links posted on this page.
If not otherwise explicitly mentioned in the body of the article, at the time of writing, the author has no position in any stock mentioned in this article and no business relationship with any company mentioned. The author has not received compensation for writing this article, other than from FXStreet.
FXStreet and the author do not provide personalized recommendations. The author makes no representations as to the accuracy, completeness, or suitability of this information. FXStreet and the author will not be liable for any errors, omissions or any losses, injuries or damages arising from this information and its display or use. Errors and omissions excepted.
The author and FXStreet are not registered investment advisors and nothing in this article is intended to be investment advice.
Recommended content
Editors’ Picks

AUD/USD stays pressured toward 0.6400; US NFP awaited
AUD/USD maintains offered tone toward 0.6400 in Friday's Asian trading. The pair faces headwinds from a borad US Dollar rebound amid souring risk sentiment on geopolitics. Rising bets for early RBA rate cuts and China's economic woes add to the pair's downside. US NFP data is next in focus.

Bitcoin experiences volatility post $100K milestone
Bitcoin rebounds to $97,000 on Friday after a volatile drop to $90,500, following its $100K milestone the day before. Ethereum maintains bullish momentum above key support levels, signaling a potential rally toward $4,000. In contrast, Ripple exhibits bearish tendencies, hinting at further declines.

Gold’s path of least resistance appears down as US Nonfarm Payrolls data looms
Gold's price extends the previous decline to reach a fresh eight-day low near $2,615 early Friday. Gold traders now look forward to the all-important Nonfarm Payrolls data for fresh impetus.

USD/JPY drops back below 150.00, looks to US NFP
USD/JPY drops back below150.00 early Friday, breaking its range play amid a slight deterioration in risk sentiment. Traders seem reluctant amid wavering expectations that the BoJ will deliver a rate hike later this month and ahead of the crucial US NFP report.

What is NFP and how does it affect the Forex market? Premium
NFP is the acronym for the Nonfarm Payrolls report, a compilation of data reflecting the employment situation in the United States (US). It shows the total number of paid workers, excluding those employed by farms, the federal government, private households, and nonprofit organisations.

Best Forex Brokers with Low Spreads
VERIFIED Low spreads are crucial for reducing trading costs. Explore top Forex brokers offering competitive spreads and high leverage. Compare options for EUR/USD, GBP/USD, USD/JPY, and Gold.