- The AUD/JPY rose in Monday's session at 97.60 with a gain of 0.23%.
- Hourly chart shows RSI and MACD dip, highlighting short-term buyers' shift to consolidate gains.
- The overall trend still favors the bulls.
In Monday's session, the AUD/JPY is trading at 97.60, registering a gain of 0.23%. The pair has seen a recent push from the buyers, which made indicators reach overbought territory and now indicators are consolidating. The overall trend still favors the buyers as the pair is still above its main Simple Moving Averages (SMAs)
Analyzing the daily chart, the Relative Strength Index (RSI), which resides within the positive territory, continues to show an increasing trend, suggesting that buyers are currently exerting pressure on the market. This aligns with the Moving Average Convergence Divergence (MACD) histogram, which printed a green bar implying that the bulls jumped back a into positive territory.
Concentrating on the hourly chart, the RSI dipped back from the overbought area struck earlier in the session to the positive domain, hinting at a more balanced, albeit still buyers-favoured, market in recent hours. In line with that, the MACD histogram has been rising, throughout the session but now seems to have flattened as buyers are taking a breather.
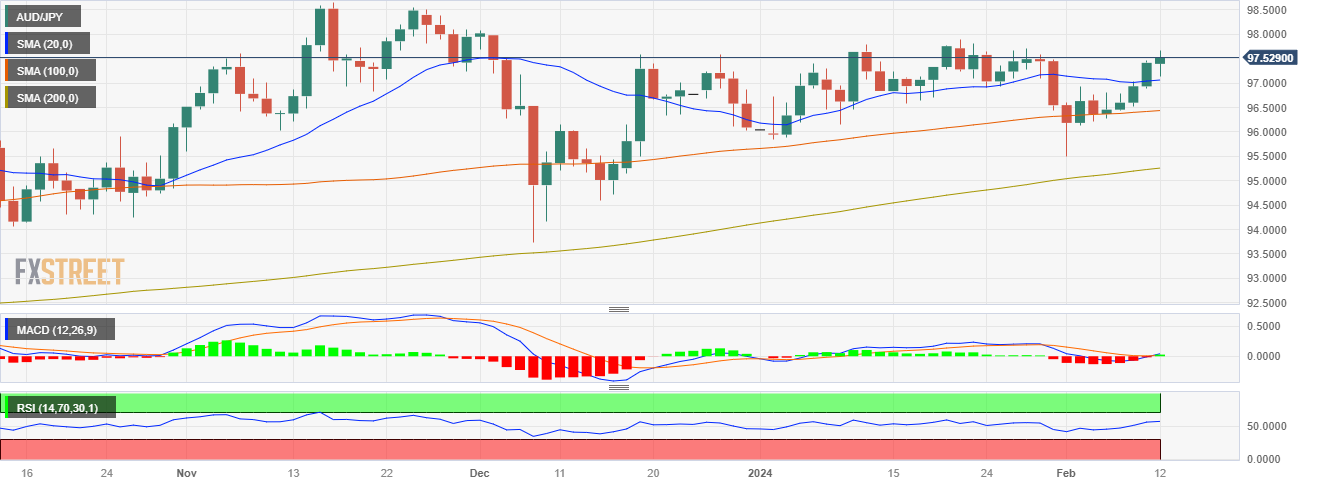
Taking the pairs' position into account relative to its main Simple Moving Averages (SMAs), the broader trend is on the buyer's side, as the pair is above the 20, 100, and 200-day SMAs. Yet, for the rest of the session, the cross may continue side-ways trade to consolidate the gains from its recent push.
AUD/JPY daily chart
Information on these pages contains forward-looking statements that involve risks and uncertainties. Markets and instruments profiled on this page are for informational purposes only and should not in any way come across as a recommendation to buy or sell in these assets. You should do your own thorough research before making any investment decisions. FXStreet does not in any way guarantee that this information is free from mistakes, errors, or material misstatements. It also does not guarantee that this information is of a timely nature. Investing in Open Markets involves a great deal of risk, including the loss of all or a portion of your investment, as well as emotional distress. All risks, losses and costs associated with investing, including total loss of principal, are your responsibility. The views and opinions expressed in this article are those of the authors and do not necessarily reflect the official policy or position of FXStreet nor its advertisers. The author will not be held responsible for information that is found at the end of links posted on this page.
If not otherwise explicitly mentioned in the body of the article, at the time of writing, the author has no position in any stock mentioned in this article and no business relationship with any company mentioned. The author has not received compensation for writing this article, other than from FXStreet.
FXStreet and the author do not provide personalized recommendations. The author makes no representations as to the accuracy, completeness, or suitability of this information. FXStreet and the author will not be liable for any errors, omissions or any losses, injuries or damages arising from this information and its display or use. Errors and omissions excepted.
The author and FXStreet are not registered investment advisors and nothing in this article is intended to be investment advice.
Recommended content
Editors’ Picks
EUR/USD stays in positive territory above 1.0850 after US data

EUR/USD clings to modest daily gains above 1.0850 in the second half of the day on Friday. The improving risk mood makes it difficult for the US Dollar to hold its ground after PCE inflation data, helping the pair edge higher ahead of the weekend.
GBP/USD stabilizes above 1.2850 as risk mood improves

GBP/USD maintains recovery momentum and fluctuates above 1.2850 in the American session on Friday. The positive shift seen in risk mood doesn't allow the US Dollar to preserve its strength and supports the pair.
Gold rebounds above $2,380 as US yields stretch lower

Following a quiet European session, Gold gathers bullish momentum and trades decisively higher on the day above $2,380. The benchmark 10-year US Treasury bond yield loses more than 1% on the day after US PCE inflation data, fuelling XAU/USD's upside.
Avalanche price sets for a rally following retest of key support level

Avalanche (AVAX) price bounced off the $26.34 support level to trade at $27.95 as of Friday. Growing on-chain development activity indicates a potential bullish move in the coming days.
The election, Trump's Dollar policy, and the future of the Yen

After an assassination attempt on former President Donald Trump and drop out of President Biden, Kamala Harris has been endorsed as the Democratic candidate to compete against Trump in the upcoming November US presidential election.