|

AUD/JPY Price Analysis: Bears step in with hourly RSI near oversold area, trend still bullish

  • The AUD/JPY is currently trading at around 97.90, reflecting a decrease of 0.55% in Wednesday's session.
  • Although the daily RSI MACD on the AUD/JPY hints at fading momentum, buyers continue establishing their upper hand.
  • However, the hourly chart indicators suggest stronger selling activity with the RSI venturing into oversold regions.

In Wednesday's session, the AUD/JPY fell to around 97.90, losing 0.55%. The short-term technical outlook hints towards a shift in command from the bears to the bulls while the overall bullish trend remains positive.

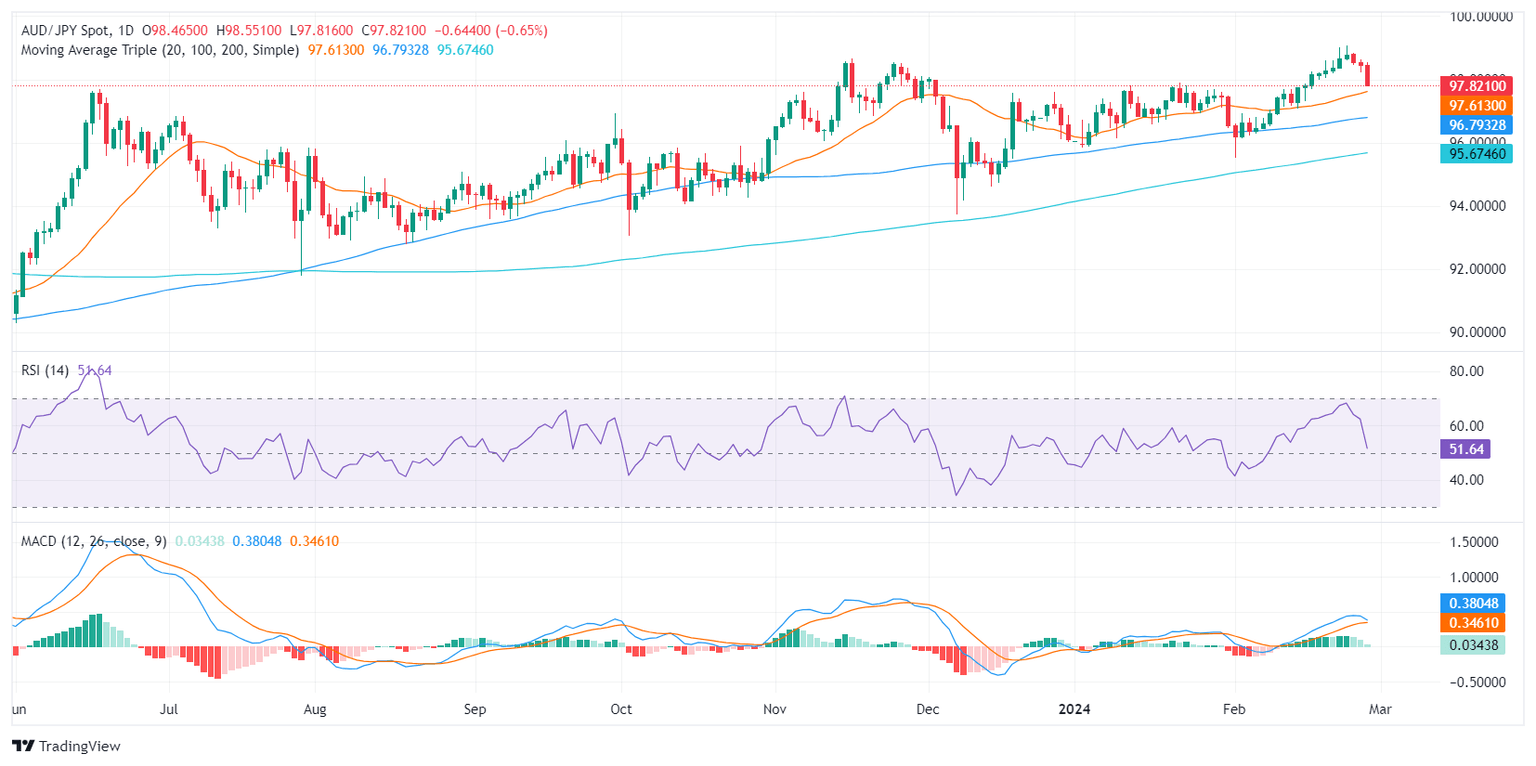
On the daily chart, the Relative Strength Index (RSI) for the AUD/JPY pair remains in positive territory, although with a declining trend. Despite the recent dip in the RSI, considering it still sits above the 50 mark, the buying pressure somewhat outweighs the selling pressure in the prevailing market conditions. However, a continuous downtrend, indicated by the RSI's negative slope since its recent peak, signifies a weakening in the buying momentum.

On the other hand, witnessing decreased green bars in the Moving Average Convergence Divergence (MACD) histogram indicates cues for a potential shift in trend. A falling MACD histogram generally means that the positive momentum is dwindling, indicating the sellers might be set to take control.

AUD/JPY daily chart

On the hourly chart, the RSI fluctuates in the negative territory, signaling increased selling activity. However, presenting a sharp contrast to the daily chart data, the hourly RSI ventures into the oversold area, which often points to a potential price correction in the near term to the upside. Also, the hourly MACD illustrates a weakening bearish momentum as suggested by the decreasing red bars which may suggest that an upward correction may be incoming..

AUD/JPY hourly chart

In retrospect, while the daily data illustrates a bullish trend, the hourly data presents that the bears took control but a slight upward correction shouldn’t be taken off the table for the rest of the session. The pair remains above the key Simple Moving Averages of 20,100 and 200 days, indicating a long-term bullish sentiment, despite short-term bearish glimpses.

AUD/JPY

Overview
Today last price97.86
Today Daily Change-0.60
Today Daily Change %-0.61
Today daily open98.46
 
Trends
Daily SMA2097.55
Daily SMA5097.21
Daily SMA10096.77
Daily SMA20095.64
 
Levels
Previous Daily High98.62
Previous Daily Low98.21
Previous Weekly High99.06
Previous Weekly Low98
Previous Monthly High97.88
Previous Monthly Low95.84
Daily Fibonacci 38.2%98.37
Daily Fibonacci 61.8%98.47
Daily Pivot Point S198.24
Daily Pivot Point S298.02
Daily Pivot Point S397.82
Daily Pivot Point R198.66
Daily Pivot Point R298.85
Daily Pivot Point R399.07

Author

Patricio Martín

Patricio is an economist from Argentina passionate about global finance and understanding the daily movements of the markets.

More from Patricio Martín
Share:

Markets move fast. We move first.

Orange Juice Newsletter brings you expert driven insights - not headlines. Every day on your inbox.

By subscribing you agree to our Terms and conditions.

Editor's Picks

EUR/USD clings to small gains near 1.1750

Following a short-lasting correction in the early European session, EUR/USD regains its traction and clings to moderate gains at around 1.1750 on Monday. Nevertheless, the pair's volatility remains low, with investors awaiting this weeks key data releases from the US and the ECB policy announcements.

GBP/USD edges higher toward 1.3400 ahead of US data and BoE

GBP/USD reverses its direction and advances toward 1.3400 following a drop to the 1.3350 area earlier in the day. The US Dollar struggles to gather recovery momentum as markets await Tuesday's Nonfarm Payrolls data, while the Pound Sterling holds steady ahead of the BoE policy announcements later in the week.

Gold pulls away from session high, holds above $4,300

Gold loses its bullish momentum and retreats below $4,350 after testing this level earlier on Monday. XAU/USD, however, stays in positive territory as the US Dollar remains on the back foot on growing expectations for a dovish Fed policy outlook next year.

Solana consolidates as spot ETF inflows near $1 billion signal institutional dip-buying

Solana price hovers above $131 at the time of writing on Monday, nearing the upper boundary of a falling wedge pattern, awaiting a decisive breakout. On the institutional side, demand for spot Solana Exchange-Traded Funds remained firm, pushing total assets under management to nearly $1 billion since launch. 

Big week ends with big doubts

The S&P 500 continued to push higher yesterday as the US 2-year yield wavered around the 3.50% mark following a Federal Reserve (Fed) rate cut earlier this week that was ultimately perceived as not that hawkish after all. The cut is especially boosting the non-tech pockets of the market.

Solana Price Forecast: SOL consolidates as spot ETF inflows near $1 billion signal institutional dip-buying

Solana (SOL) price hovers above $131 at the time of writing on Monday, nearing the upper boundary of a falling wedge pattern, awaiting a decisive breakout.