|

AUD/JPY Price Analysis: Plunges over 1% as bearish engulfing pattern emerges, 93.00 in sight for bears

  • AUD/JPY witnessed a significant drop, trading around 94.57 in the Asian session.
  • Bearish engulfing candlestick pattern on the daily chart signals potential further declines.
  • Key support and resistance levels are outlined amidst the prevailing bearish bias.

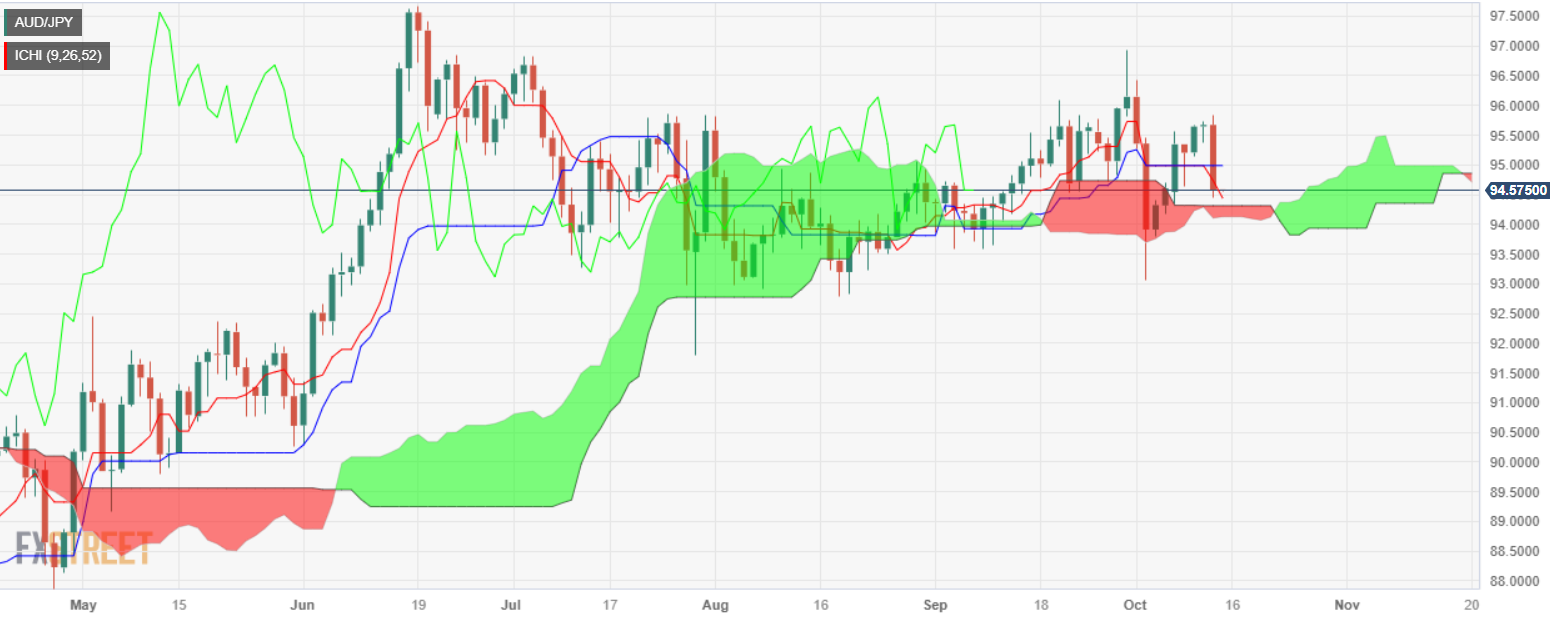
AUD/JPY plunged more than 1% on Thursday as investors speculated the US Federal Reserve (Fed) could increase rates before the end of 2023, a headwind for risk-perceived currencies like the Aussie Dollar (AUD). Therefore, the cross-pair extends its losses and exchanges hands at around 94.57 as the Asian session begins.

From a daily chart perspective, the pair is neutral to downward biased; due to aggressive selling pressure mounting on Thursday, it formed a bearish engulfing candlestick pattern that comprises price action from the whole week. That said, the AUD/JPY could print new lows below the 94.00 figure.

The AUD/JPY first support would be the Ichimoku Cloud (Kumo) at around the 94.10/30 area, which, once cleared, would expose the psychological 94.00 mark. If that level is broken, the following demand area to test would be October 3, swing low of 93.01, before the pair slumps towards July 28, swing low of 91.79.

Conversely, if AUD/JPY stays above 94, the first resistance would be the Kijun-Sen at 94.97 before climbing above 95.00. If rallying above that level, up next would be the July 3 high at 96.83.

AUD/JPY Price Action – Daily chart

AUD/JPY Technical Levels

AUD/JPY

Overview
Today last price94.58
Today Daily Change-1.09
Today Daily Change %-1.14
Today daily open95.67
 
Trends
Daily SMA2095.23
Daily SMA5094.51
Daily SMA10094.56
Daily SMA20092.47
 
Levels
Previous Daily High95.73
Previous Daily Low95.37
Previous Weekly High96.42
Previous Weekly Low93.05
Previous Monthly High96.92
Previous Monthly Low93.59
Daily Fibonacci 38.2%95.59
Daily Fibonacci 61.8%95.51
Daily Pivot Point S195.45
Daily Pivot Point S295.23
Daily Pivot Point S395.09
Daily Pivot Point R195.81
Daily Pivot Point R295.96
Daily Pivot Point R396.18

Author

Christian Borjon Valencia

Markets analyst, news editor, and trading instructor with over 14 years of experience across FX, commodities, US equity indices, and global macro markets.

More from Christian Borjon Valencia
Share:

Editor's Picks

EUR/USD: US Dollar comeback in the makes?

The US Dollar stands victorious at the end of another week, with the EUR/USD pair trading near a four-week low of 1.1742, while the USD retains its strength despite some discouraging American data released at the end of the week. The pair edged higher on Friday, after the United States Supreme Court ruled against President Donald Trump's tariffs, although the advance is not enough to change the latest USD flow.

GBP/USD braces for more pain, as 200-day SMA tested

GBP/USD broke the previous week’s consolidation to the downside, as sellers returned with pomp, smashing the major back toward the levels last seen in late January. The pair tested bids below the 1.3450 barrier as the US Dollar strength largely played out throughout the week, while the Pound Sterling stepped back on expectations of divergent monetary policy outlooks between the Bank of England and the US Federal Reserve.

Gold climbs to weekly tops, approaches $5,100/oz

Gold keeps the bid tone well in place at the end of the week, now hitting fresh weekly highs and retargeting the key $5,100 mark per troy ounce. The move higher in the yellow metal comes in response to ongoing geopolitical tensions in the Middle East and modest losses in the US Dollar.

Week ahead: Markets brace for heightened volatility as event risk dominates

Dollar strength dominates markets as risk appetite remains subdued. A Supreme Court ruling, geopolitics and Fed developments are in focus. Pivotal Nvidia earnings on Wednesday as investors question tech sector weakness. Yen and aussie diverge; both pound and euro could recoup their losses.

Broadening drivers of growth: Unpacking GDP and looking ahead

This week’s data delivered a familiar theme with an important twist. The U.S. economy continues to be shaped by powerful forces in high-tech and AI-related investment, but recent releases suggest the growth story may finally be broadening. At the same time, trade flows are moving in a less supportive direction, reminding us that not all parts of the economy are pulling in sync.

Ripple bulls defend key support amid waning retail demand and ETF inflows

XRP ticks up above $1.40 support, but waning retail demand suggests caution. XRP attracts $4 million in spot ETF inflows on Thursday, signaling renewed institutional investor interest.