|

AUD/JPY Price Analysis: Back below 94.00 as sellers eye 93.00

  • The Australian Dollar registers decent losses vs. the Japanese Yen amidst an upbeat sentiment.
  • The lack of catalyst and price action trapped within 93.00-94.00 keeps the AUD/JPY sideways.
  • AUD/JPY Price Analysis: RSI’s turning bearish could open the door for a fall to 93.00.

The Australian Dollar (AUD) edges lower against the Japanese Yen (JPY) after traveling throughout the day within the 94.00-93.11 range on Thursday, hoovering below the 50 and 100-day Exponential Moving Averages (EMAs). As the Asian Pacific session begins, the AUD/JPY is trading at 93.70, below its opening price by 0.20%.

AUD/JPY Price Analysis: Technical outlook

The AUD/JPY daily chart portrays the cross, consolidated within the 93.00-94.00 range, for the last six days. Even though the 50 and 100-day Exponential Moving Averages (EMAs) around 93.87 and 94.28, respectively, above the spot price, suggest the cross is downward biased, a flat slope confirms a neutral bias.

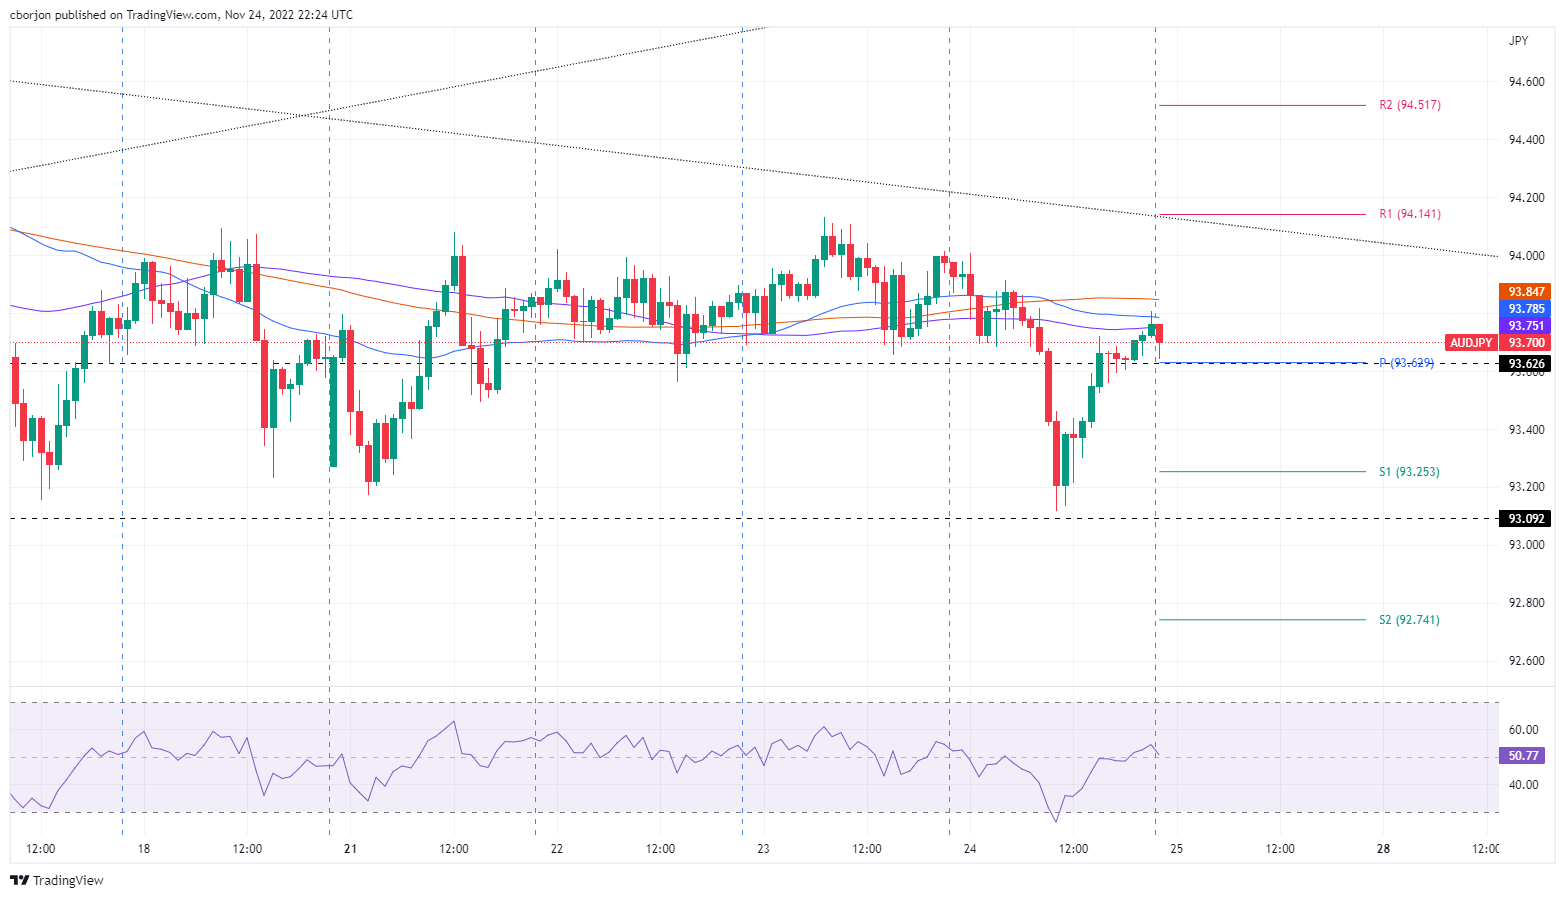
Short term, the AUD/JPY 1-hour chart portrays the 50, 100, and 200-EMAs seesawing around the price action. On Thursday, the AUD/JPY dived sharply below the Exponential Moving Averages (EMAs), opening the door for lower prices. Investors should be aware that the Relative Strength Index (RSI) crossed below the 50-midline to bearish territory, showing that sellers are gathering momentum.

Therefore, the AUD/JPY first support would be the daily pivot point at 93.63. The break below will expose the S1 daily pivot at 93.25, followed by this week’s low at 93.11. In the event of breaking upwards, the AUD/JPY first resistance would be the 200-EMA at 93.84, which, once cleared, would expose the 94.00 figure.

AUD/JPY Key Technical  Levels

AUD/JPY

Overview
Today last price93.74
Today Daily Change-0.26
Today Daily Change %-0.28
Today daily open94
 
Trends
Daily SMA2094.1
Daily SMA5093.99
Daily SMA10094.3
Daily SMA20092.51
 
Levels
Previous Daily High94.14
Previous Daily Low93.69
Previous Weekly High94.66
Previous Weekly Low92.92
Previous Monthly High95.75
Previous Monthly Low90.84
Daily Fibonacci 38.2%93.97
Daily Fibonacci 61.8%93.86
Daily Pivot Point S193.74
Daily Pivot Point S293.49
Daily Pivot Point S393.29
Daily Pivot Point R194.19
Daily Pivot Point R294.39
Daily Pivot Point R394.64

Author

Christian Borjon Valencia

Markets analyst, news editor, and trading instructor with over 14 years of experience across FX, commodities, US equity indices, and global macro markets.

More from Christian Borjon Valencia
Share:

Editor's Picks

EUR/USD breaks below 1.1800, two-week lows

EUR/USD’s selling pressure is gathering pace now, breaching below the key 1.1800 yardstick to hit new two-week troughs on Wednesday. The pair’s pullback comes on the back of marked gains in the US Dollar following US data releases and ahead of the publication of the FOMC Minutes.

GBP/USD reaches multi-day lows near 1.3500

GBP/USD reverses its initial upside momentum and is now adding to previous declines, approaching the 1.3500 region on Wednesday. Cable’s downtick comes on the back of decent gains in the Greenback and easing UK inflation figures, which seem to have reinforced the case for a BoE rate cut in March.

Gold battle to regain $5,000 continues

Gold is back on the front foot on Wednesday, shaking off part of the early week softness and challenging two-day highs near the $5,000 mark per troy ounce. The move comes ahead of the FOMC Minutes and is unfolding despite an intense rebound in the US Dollar.

Fed Minutes to shed light on January hold decision amid hawkish rate outlook

The Minutes of the Fed’s January 27-28 monetary policy meeting will be published today. Details of discussions on the decision to leave the policy rate unchanged will be scrutinized by investors.

Mixed UK inflation data no gamechanger for the Bank of England

Food inflation plunged in January, but service sector price pressure is proving stickier. We continue to expect Bank of England rate cuts in March and June. The latest UK inflation read is a mixed bag for the Bank of England, but we doubt it drastically changes the odds of a March rate cut.

Sui extends sideways action ahead of Grayscale’s GSUI ETF launch

Sui is extending its downtrend for the second consecutive day, trading at 0.95 at the time of writing on Wednesday. The Layer-1 token is down over 16% in February and approximately 34% from the start of the year, aligning with the overall bearish sentiment across the crypto market.