|

AUD/JPY Price Analysis: An upward break of a bullish flag keep bulls in control, eyeing 83.00

  • The AUD/JPY upside breaks confirm a bullish flag as bulls regain control above the 82.00 mark.
  • AUD/JPY Technical Outlook: Despite being upward biased, would need a daily close above the 100-DMA to cement the uptrend.

The AUD/JPY breaks upward, above the 100 and the 200-day moving averages (DMAs), at 82.53 and 82.40, respectively. At the time of writing, the AUD/JPY cross-currency is trading at 82.56.

The market sentiment is upbeat. US equity indices ended in the green, while Asian stock futures point to a higher open. The risk-sensitive AUD was bolstered in the FX complex, while the JPY was the laggard on the Tuesday session, courtesy of the rise in US T-bond yields, with the 10-year yield, at 1.965%.

AUD/JPY Price Forecast: Technical outlook

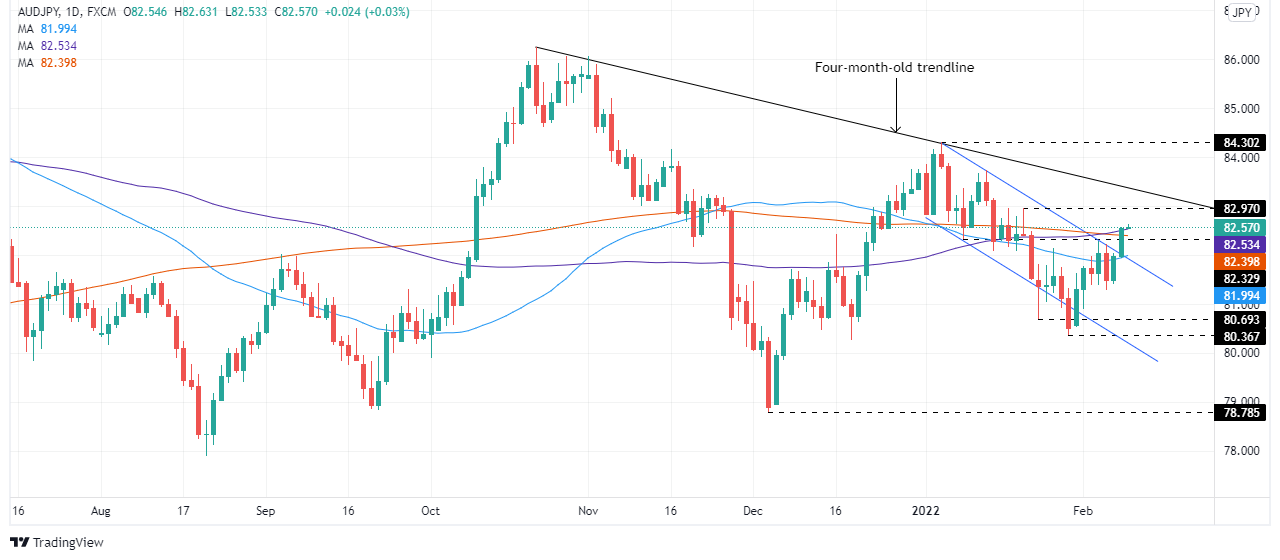
The AUD/JPY broke a bullish flag to the upside, though the 100-DMA capped the move. However, the long-real body of Tuesday’s price action suggests that the uptrend could accelerate towards fresh daily highs, even opening the door for a challenge of the YTD high.

That said, the AUD/JPY first resistance would be January 20 daily high at 82..97. Breach of the latter would expose a four-month-old downslope trendline around the 83.25-40 range, followed by the psychological 84.00 figure.

Contrarily, failure to reclaim 83.00 could pave the way for further losses in the AUD/JPY pair. The first support would be 82.00, pushing the price below the top-trendline of the bullish flag, viewed as a false breakout. A crackdown of the 82.00 mark would expose January 24 daily low at 80.69, followed by January 28 at 80.36.

AUD/JPY

Overview
Today last price82.56
Today Daily Change0.60
Today Daily Change %0.73
Today daily open81.96
 
Trends
Daily SMA2081.99
Daily SMA5081.95
Daily SMA10082.51
Daily SMA20082.46
 
Levels
Previous Daily High82.05
Previous Daily Low81.41
Previous Weekly High82.29
Previous Weekly Low80.55
Previous Monthly High84.3
Previous Monthly Low80.37
Daily Fibonacci 38.2%81.81
Daily Fibonacci 61.8%81.66
Daily Pivot Point S181.57
Daily Pivot Point S281.17
Daily Pivot Point S380.93
Daily Pivot Point R182.21
Daily Pivot Point R282.45
Daily Pivot Point R382.85

Author

Christian Borjon Valencia

Markets analyst, news editor, and trading instructor with over 14 years of experience across FX, commodities, US equity indices, and global macro markets.

More from Christian Borjon Valencia
Share:

Editor's Picks

EUR/USD falls to near 1.1600 due to persistent bearish bias

EUR/USD depreciates after registering modest gains in the previous session, trading around 1.1610 during the Asian hours on Thursday. The technical analysis of the daily chart suggests a persistent bearish bias as the EUR/USD pair remains within the descending channel pattern.

GBP/USD underperforms as UK faces stagflation risks amid Middle East war

The Pound Sterling trades lower against its major currency peers, is down 0.22% around 1.3340 against the US Dollar, during the Asian trade on Thursday. The British currency faces selling pressures amid fears that the United Kingdom economy could face stagflation risks due to higher energy prices, a situation in which inflation accelerates with economic growth and employment conditions remaining stagnant.

Gold climbs near $5,200 as Iran war fuels safe-haven demand

Gold price extends its gains for the second successive session on Thursday as traders seek safety amid the ongoing war in the Middle East. US and Israeli strikes across Iranian territory and widespread Iranian missile and drone retaliation across the Middle East, including attacks on regional targets and military sites, prolong the crisis and its impact.

Top Crypto Gainers: Decred, Zcash, and Dogecoin lead recovery as Bitcoin crosses $72,000

Bitcoin trades above $72,500 at press time on Thursday, holding its 6% gain from the previous day, contributing to a broader market recovery. The total cryptocurrency market capitalization stands at over $2.43 trillion as the broader market sentiment improves significantly.

First Venezuela, now Iran: The US-China energy war escalates

At first glance, the latest escalation involving the United States with both Iran and Venezuela looks like another chapter in a long-running geopolitical story. But viewed through a broader strategic lens, something else may be unfolding: Energy.

Cardano Price Analysis: Approaches key trendline amid bearish sentiment

Cardano (ADA) price is approaching its descending trendline around $0.28 at the time of writing, set to shape the next directional move. The derivatives metrics paint a bearish picture, with ADA’s Open Interest continuing to fall and short bets rising among traders.