AT&T Inc. (T) is an American multinational telecommunications holding company headquartered in Dallas, Texas. It is the world’s largest telecommunications company by revenue and the third-largest provider of mobile telephone services in the U.S.
AT&T (T) monthly chart April 2024
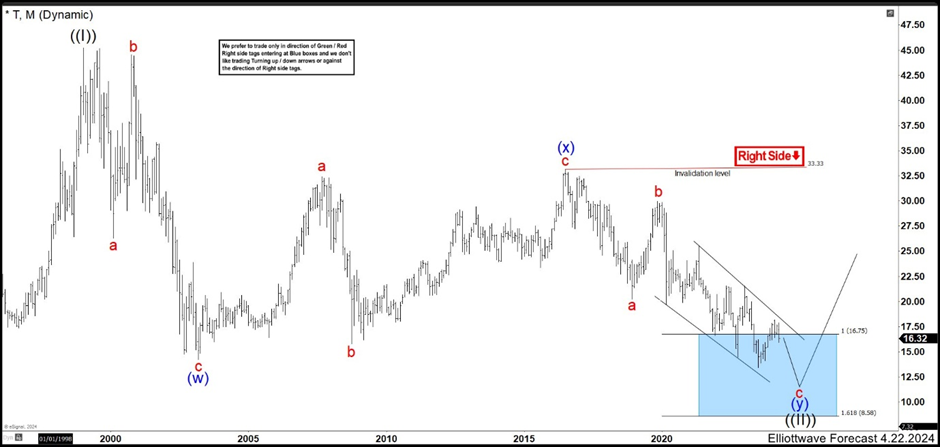
Above we have montly chart from 5 months ago. We can see that AT&T shares finished an all-time high with a price of $45.23 as wave ((I)). Since the beginning of 1999, the value held a downtrend and we were looking to end this correction. Using the Elliott Wave Principle, a double correction structure (w), (x) and (y) can be clearly seen. From the peak, we have 3 waves in a flat structure that ended wave (w) at $14.17 low. Then, we had another flat structure that built a wave (x) ending in the value of $33.33 high.
The last leg of the double correction is the wave (y). We had already completed wave a and b of (y), and we were developing wave c as an ending diagonal. The market had already reached the blue box in the $8.58 – $16.75 area expecting a rally soon because the market had break wave (w) low and the cycle could have ended. However, we were looking for one more leg lower to complete a clear structure below $13.43 to end wave ((II)) correction and resume the rally.
AT&T (T) monthly chart September 2024
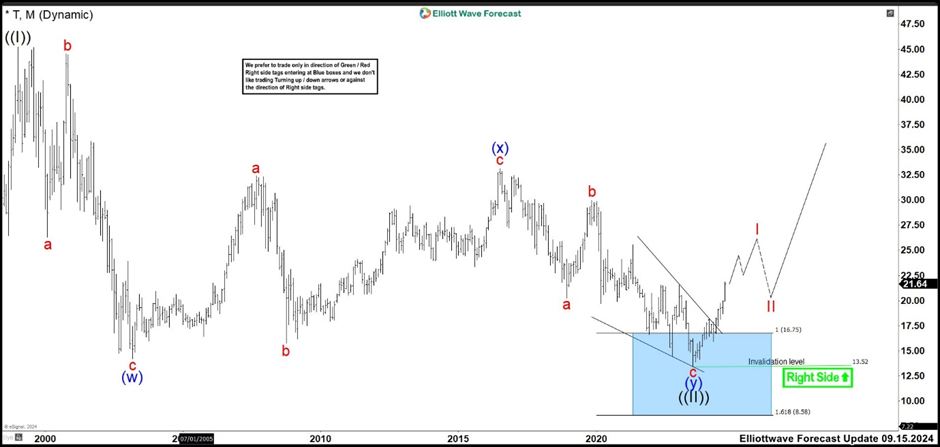
On the current monthly chart, we can see the rally that left the blue box. This invalidated the bearish continuation of the ending diagonal as wave c. The rally does not mean that T cannot resume to the downside again. To confirm that wave ((II)) is over at $13.43 low, the market needs to break above of wave (x) high. Until then, T could make perfectly any other structure that leads us to lower prices.
AT&T (T) weekly chart September 2024
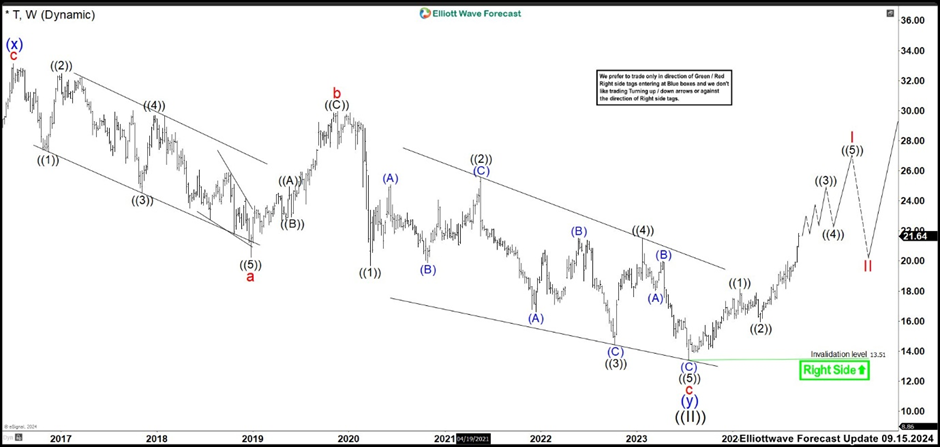
The weekly chart above shows how the wave ((5)) of c of the ending diagonal completed the structure. The (A), (B), (C) looks like more as the wave ((1)) and we were looking for one more like wave ((3)). That is why we were calling for more one more leg lower. Wave ((II)) ended at $13.43 low and rally and it should be developing an impulse higher as wave I. The first leg higher as wave ((1)) ended at $18.16 high. Wave ((2)) pullback finished at $15.94 low and rally again. AT&T has pushed strongly higher breaking the pivots of the RSI in the weekly timeframe, suggesting the market cycle is over. Now, we should expect to build an impulse structure as the chart before seeing 3, 7 or 11 swings correction as wave II.
FURTHER DISCLOSURES AND DISCLAIMER CONCERNING RISK, RESPONSIBILITY AND LIABILITY Trading in the Foreign Exchange market is a challenging opportunity where above average returns are available for educated and experienced investors who are willing to take above average risk. However, before deciding to participate in Foreign Exchange (FX) trading, you should carefully consider your investment objectives, level of xperience and risk appetite. Do not invest or trade capital you cannot afford to lose. EME PROCESSING AND CONSULTING, LLC, THEIR REPRESENTATIVES, AND ANYONE WORKING FOR OR WITHIN WWW.ELLIOTTWAVE- FORECAST.COM is not responsible for any loss from any form of distributed advice, signal, analysis, or content. Again, we fully DISCLOSE to the Subscriber base that the Service as a whole, the individual Parties, Representatives, or owners shall not be liable to any and all Subscribers for any losses or damages as a result of any action taken by the Subscriber from any trade idea or signal posted on the website(s) distributed through any form of social-media, email, the website, and/or any other electronic, written, verbal, or future form of communication . All analysis, trading signals, trading recommendations, all charts, communicated interpretations of the wave counts, and all content from any media form produced by www.Elliottwave-forecast.com and/or the Representatives are solely the opinions and best efforts of the respective author(s). In general Forex instruments are highly leveraged, and traders can lose some or all of their initial margin funds. All content provided by www.Elliottwave-forecast.com is expressed in good faith and is intended to help Subscribers succeed in the marketplace, but it is never guaranteed. There is no “holy grail” to trading or forecasting the market and we are wrong sometimes like everyone else. Please understand and accept the risk involved when making any trading and/or investment decision. UNDERSTAND that all the content we provide is protected through copyright of EME PROCESSING AND CONSULTING, LLC. It is illegal to disseminate in any form of communication any part or all of our proprietary information without specific authorization. UNDERSTAND that you also agree to not allow persons that are not PAID SUBSCRIBERS to view any of the content not released publicly. IF YOU ARE FOUND TO BE IN VIOLATION OF THESE RESTRICTIONS you or your firm (as the Subscriber) will be charged fully with no discount for one year subscription to our Premium Plus Plan at $1,799.88 for EACH person or firm who received any of our content illegally through the respected intermediary’s (Subscriber in violation of terms) channel(s) of communication.
Recommended content
Editors’ Picks

EUR/USD weakens below 1.0900 on trade tensions
The EUR/USD pair loses ground to around 1.0880 during the Asian trading hours on Thursday. The escalating trade tension between the United States and the European Union exerts some selling pressure on the Euro against the Greenback.

Gold price retains positive bias for the third straight day; remains close to all-time peak
Gold price attracts buyers for the third successive day and climbs to the $2,947 region during the Asian session on Thursday, back closer to the all-time peak touched on February 24.

GBP/USD maintains position above 1.2950 near four-month highs
GBP/USD attempts to extend its gains for the third successive day, trading around 1.2960 during the Asian session on Thursday. The GBP/USD pair rises as the US Dollar faces headwinds amid ongoing tariff uncertainty from Trump and growing concerns over a potential US recession.

Ethereum: Staking could be catalyst to drive ETH's price 'more than Pectra upgrade': K33 Research
Ethereum traded around $1,860 in the Asian session on Thursday as its price remained largely subdued by bearish sentiment weighing on the general crypto market.

Brexit revisited: Why closer UK-EU ties won’t lessen Britain’s squeezed public finances
The UK government desperately needs higher economic growth as it grapples with spending cuts and potential tax rises later this year. A reset of UK-EU economic ties would help, and sweeping changes are becoming more likely.

The Best brokers to trade EUR/USD
SPONSORED Discover the top brokers for trading EUR/USD in 2025. Our list features brokers with competitive spreads, fast execution, and powerful platforms. Whether you're a beginner or an expert, find the right partner to navigate the dynamic Forex market.