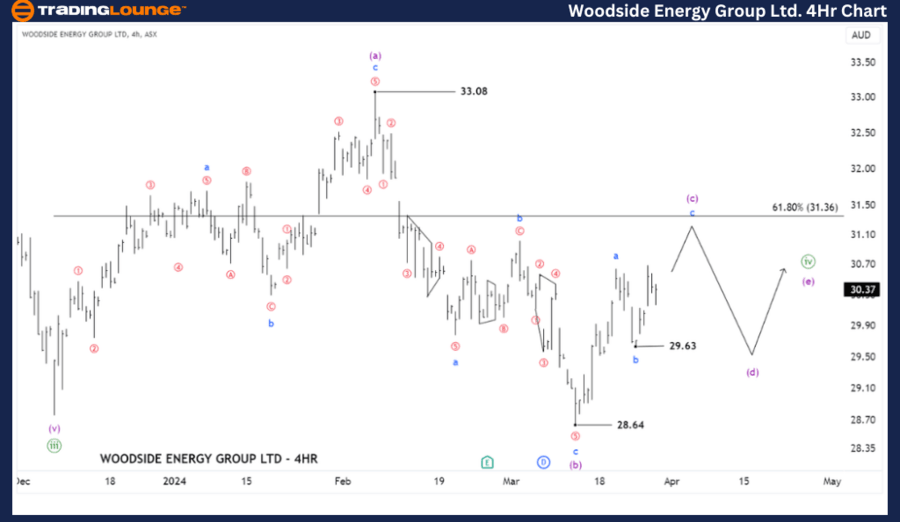
Our Elliott Wave analysis today updates the Australian Stock Exchange (ASX) with WOODSIDE ENERGY GROUP LTD - WDS. We ascertain that wave ((iv))-green is evolving as a Triangle Correction, and its wave (c)-purple may continue to rise a bit further. And after the entire Triangle Correction concludes with wave ((iv)), wave ((v))-green will return to push lower.

ASX: WDS Elliott Wave technical analysis  

Function: Major trend (Minute degree, green).

Mode: Motive.

Structure: Impulse.

Position: Wave ((iv))-green.

Details: The short-term outlook suggests that wave ((iv))-green has been initiated, with expectations of it forming a corrective Triangle pattern. Therefore, it can be inferred that wave ((iv)) will likely continue to move sideways for some time before wave ((v))-green resumes to push lower.
Invalidation point: 33.08

Chart

ASX: WDS Elliott Wave technical analysis

Function: Counter trend (Minuette degree, purple).

Mode: Corrective.

Structure: Triangle.

Position: Wave (c)-purple.

Details: The shorter-term outlook further describes the detailed subdivisions of wave ((iv))-green as a Triangle Correction. Waves (a) and (b)-purple have completed, and now wave (c)-purple is unfolding. Typically, wave (c) exhibits a common retracement ratio compared to wave (a) within a Triangle Correction, and the target for this ratio is around 31.36. Therefore, we can expect wave (c) to rise to test that resistance level.

Invalidation point: 33.08

Chart

Conclusion  

Our analysis, forecast of contextual trends, and short-term outlook for ASX: FORTESCUE LTD – FMG aim to provide readers with insights into the current market trends and how to capitalize on them effectively. We offer specific price points that act as validation or invalidation signals for our wave count, enhancing the confidence in our perspective. By combining these factors, we strive to offer readers the most objective and professional perspective on market trends.

ASX: WDS Elliott Wave technical analysis [Video]

Share: Feed news

As with any investment opportunity there is a risk of making losses on investments that Trading Lounge expresses opinions on.

Historical results are no guarantee of future returns. Some investments are inherently riskier than others. At worst, you could lose your entire investment. TradingLounge™ uses a range of technical analysis tools, software and basic fundamental analysis as well as economic forecasts aimed at minimizing the potential for loss.

The advice we provide through our TradingLounge™ websites and our TradingLounge™ Membership has been prepared without considering your objectives, financial situation or needs. Reliance on such advice, information or data is at your own risk. The decision to trade and the method of trading is for you alone to decide. This information is of a general nature only, so you should, before acting upon any of the information or advice provided by us, consider the appropriateness of the advice considering your own objectives, financial situation or needs. Therefore, you should consult your financial advisor or accountant to determine whether trading in securities and derivatives products is appropriate for you considering your financial circumstances.

Recommended content


Recommended content

Editors’ Picks

AUD/USD holds the bounce toward 0.6250 after China's Caixin Services PMI

AUD/USD holds the bounce toward 0.6250 after China's Caixin Services PMI

AUD/USD sustains the rebound toward 0.6250 in the Asian session on Monday after China's Caixin Services PMI beat estimates with 52.2 in December. China's stimulus optimism and a subdued US Dollar offset increased bets for early RBA rate cuts, reviving the demand for the Aussie. 

AUD/USD News
USD/JPY: Upside remains capped below 158.00 amid cautious mood

USD/JPY: Upside remains capped below 158.00 amid cautious mood

USD/JPY is consolidating the upside below 158.00 in Asian trading on Monday. The pair feels the heat from a cautious risk tone and a broadly subdued US Dollar but the divergent Fed-BoJ policy expectatations help keep it afloat in the Nonfarm Payrolls week. 

USD/JPY News
Gold buyers stay hopeful whilst above 21-day SMA support

Gold buyers stay hopeful whilst above 21-day SMA support

Gold price finds support and looks at $2,650 as the US Nonfarm Payrolls week begins. The US Dollar corrects further despite firm US Treasury bond yields and a cautious mood. Technically, daily indicators continue to paint a bullish picture for Gold price.

Gold News
Bitcoin, Ethereum and Ripple show signs of bullish momentum

Bitcoin, Ethereum and Ripple show signs of bullish momentum

Bitcoin’s price is approaching its key psychological level of $100,000; a firm close above would signal the continuation of the ongoing rally. Ethereum price closes above its upper consolidation level of $3,522, suggesting bullish momentum. While Ripple price trades within a symmetrical triangle on Monday.

Read more
Week ahead – US NFP to test the markets, Eurozone CPI data also in focus

Week ahead – US NFP to test the markets, Eurozone CPI data also in focus

King Dollar flexes its muscles ahead of Friday’s NFP. Eurozone flash CPI numbers awaited as euro bleeds. Canada’s jobs data to impact bets of a January BoC cut. Australia’s CPI and Japan’s wages also on tap.

Read more
Best Forex Brokers with Low Spreads

Best Forex Brokers with Low Spreads

VERIFIED Low spreads are crucial for reducing trading costs. Explore top Forex brokers offering competitive spreads and high leverage. Compare options for EUR/USD, GBP/USD, USD/JPY, and Gold.

Read More

Forex MAJORS

Cryptocurrencies

Signatures