ASX trading success: National Australia Bank Limited [Video]
![ASX trading success: National Australia Bank Limited [Video]](https://editorial.fxstreet.com/images/Markets/Equities/Industries/CommercialServices/office-meeting_XtraLarge.jpg)
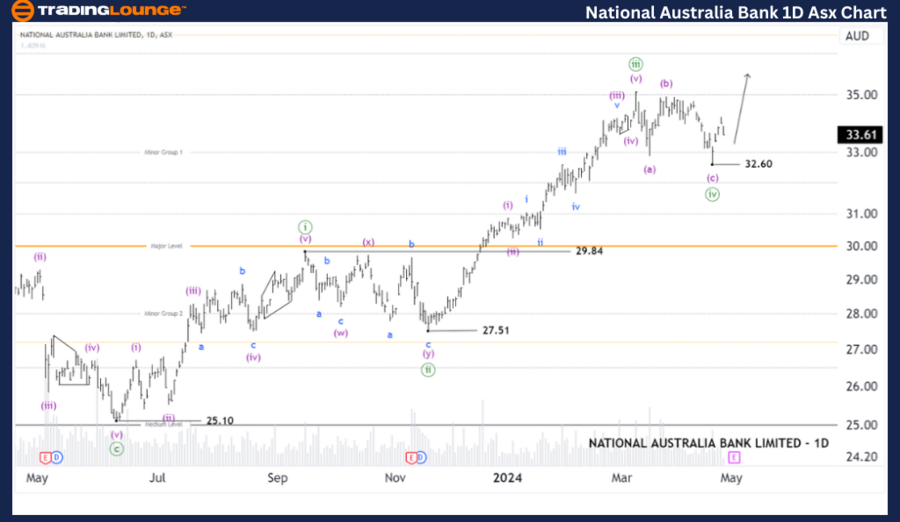
ASX: NATIONAL AUSTRALIA BANK LIMITED - NAB Elliott Elliott Wave Technical Analysis TradingLounge (1D Chart).
Greetings, Our Elliott Wave analysis today updates the Australian Stock Exchange (ASX) with NATIONAL AUSTRALIA BANK LIMITED - NAB. We identify wave ((iv))-green as having ended, and the potential for wave ((v))-green is open to push higher.
ASX: National Australia Bank Limited - NAB Elliott Wave technical analysis
ASX: NATIONAL AUSTRALIA BANK LIMITED - NAB 1D Chart (Semilog Scale) Analysis.
Function: Major trend (Minute degree, green).
Mode: Motive.
Structure: Impulse.
Position: Wave ((v))-green.
Details: The short-term outlook shows that wave ((iv))-green has just ended, and the push up quite high since 32.60 also suggests the return of wave ((v))-green.
Invalidation point: 32.60.
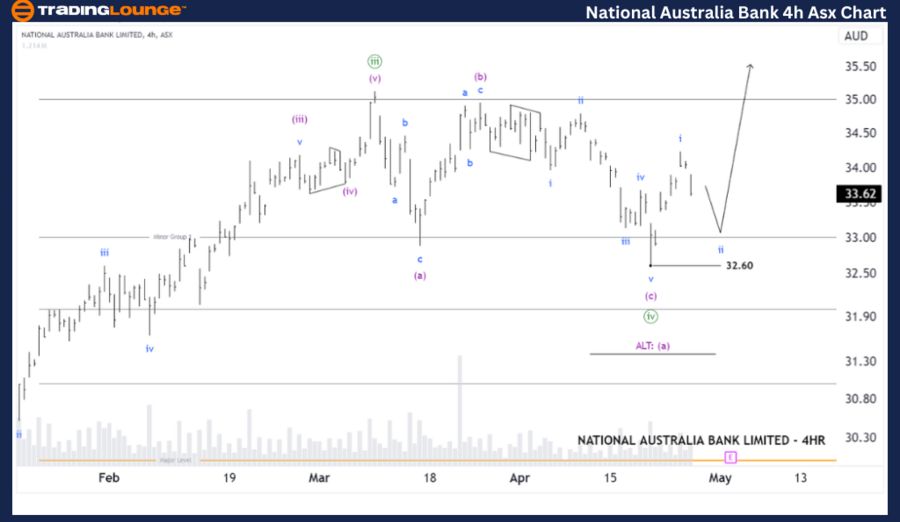
ASX: NATIONAL AUSTRALIA BANK LIMITED - NAB Elliott Wave Technical Analysis TradingLounge (4-Hour Chart)
ASX: National Australia Bank Limited - NAB Elliott Wave technical analysis
ASX: NATIONAL AUSTRALIA BANK LIMITED - NAB 4-Hour Chart Analysis.
Function: Major trend (Minute degree, green).
Mode: Motive.
Structure: Impulse.
Position: Wave i-blue of Wave ((v))-green.
Details: The shorter-term outlook suggests that the ((iii))-green wave has recently peaked, and the ((iv))-green wave has unfolded in the form of a Flat correction, with the ((iv))-wave likely completed. The ((v))-green wave is now unfolding to push prices higher. We are closely monitoring NAB, and there will soon be a long-term trading opportunity with NAB. It looks like wave ii-blue is opening up, pushing a little lower, before wave iii-blue returns to push even higher.
Invalidation point: 32.60
Conclusion
Our analysis, forecast of contextual trends, and short-term outlook for ASX: NATIONAL AUSTRALIA BANK LIMITED - NAB aim to provide readers with insights into the current market trends and how to capitalize on them effectively. We offer specific price points that act as validation or invalidation signals for our wave count, enhancing the confidence in our perspective. By combining these factors, we strive to offer readers the most objective and professional perspective on market trends.
Technical analyst: Hua (Shane) Cuong, CEWA-M (Master’s Designation).
Author

Peter Mathers
TradingLounge
Peter Mathers started actively trading in 1982. He began his career at Hoei and Shoin, a Japanese futures trading company.


