ASX Elliott Wave technical forecast [Video]
![ASX Elliott Wave technical forecast [Video]](https://editorial.fxstreet.com/images/Markets/Equities/Bovespa/bm-amp-f-75135517_XtraLarge.jpg)
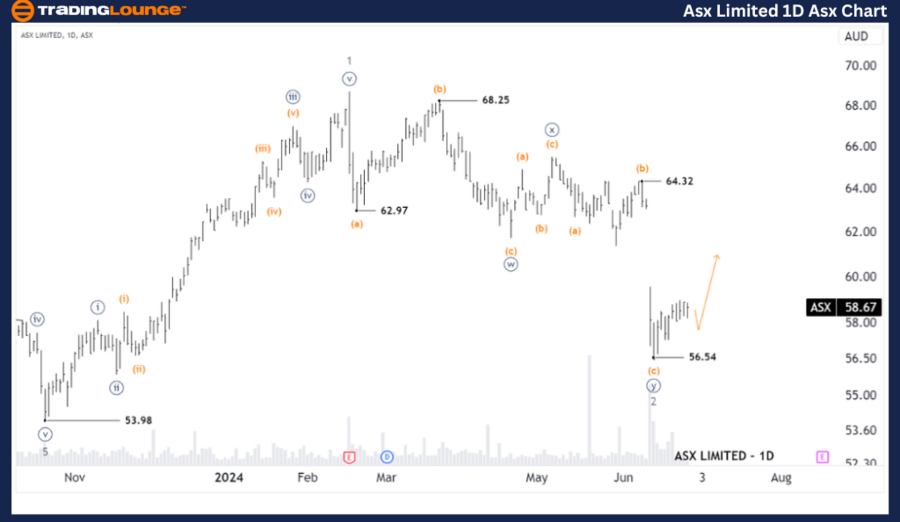
ASX: ASX LIMITED - ASX Elliott Elliott Wave Technical Analysis TradingLounge (1D Chart).
Greetings, Our Elliott Wave analysis today updates the Australian Stock Exchange (ASX) with ASX LIMITED - ASX. We observe that ASX LIMITED is approaching the end of wave 2-grey, but needs more evidence on price action for confirmation, also allowing wave 3-grey to be opened to push higher thereafter.
ASX: ASX Limited - ASX Elliott Wave technical analysis
ASX: ASX LIMITED - ASX 1D Chart (Semilog Scale) Analysis.
Function: Major (Minor degree, grey).
Mode: Motive.
Structure: Impulse.
Position: Wave 3-grey.
Details: The short-term outlook shows some evidence that wave 2-grey has ended. Wave 3-grey appears to be unfolding to push higher, a move above the 64.32 high would confirm this view.
Invalidation point: 56.54.
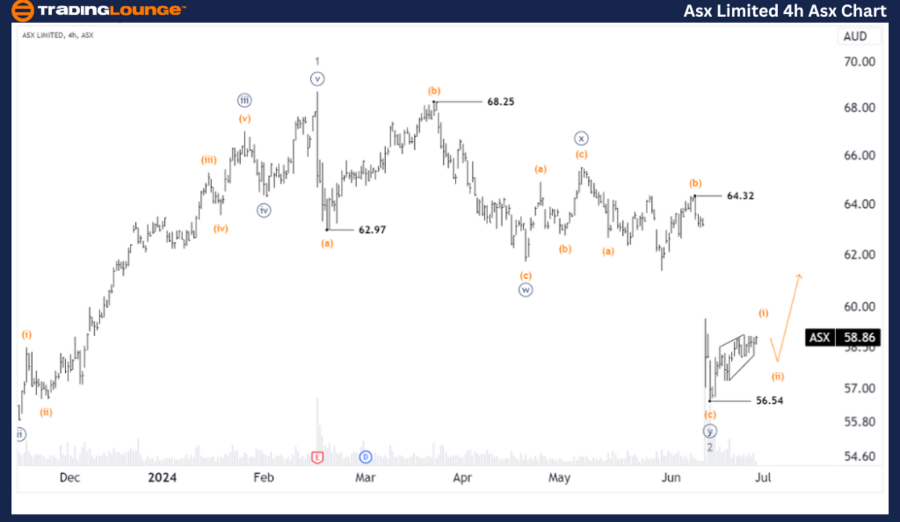
ASX: ASX LIMITED - ASX Elliott Wave Technical Analysis TradingLounge (4- Hour Chart).
ASX: ASX Limited - ASX Elliott Wave technical analysis
ASX: ASX LIMITED - ASX 4-Hour Chart Analysis.
Function: Major Trend (Minor degree, grey).
Mode: Motive.
Structure: Impulse.
Position: Wave (i)-orange Wave 2-grey.
Details: The short-term outlook shows that wave 2-grey has some evidence of having ended, and wave 3-grey may be unfolding to push higher. Wave (i)-orange may be opening, followed by wave (ii)-orange pushing slightly lower, and we will look for evidence of wave (ii)-orange ending, to guide to target wave (iii)-orange. It is important that the price remains above 56.54 to maintain the point, and a push higher from 64.32 would confirm the view that the 3-grey wave is indeed back.
Invalidation point: 56.54.
Conclusion
Our analysis, forecast of contextual trends, and short-term outlook for ASX: ASX LIMITED - ASX aim to provide readers with insights into the current market trends and how to capitalize on them effectively. We offer specific price points that act as validation or invalidation signals for our wave count, enhancing the confidence in our perspective. By combining these factors, we strive to offer readers the most objective and professional perspective on market trends.
Technical analyst: Hua (Shane) Cuong, CEWA-M (Master’s Designation).
ASX: ASX Limited - ASX Elliott Wave technical analysis [Video]
Author

Peter Mathers
TradingLounge
Peter Mathers started actively trading in 1982. He began his career at Hoei and Shoin, a Japanese futures trading company.


