Greetings, Our Elliott Wave analysis todaya updates the Australian Stock Exchange (ASX) with RMD – RESMES INC shares. We have identified a Expanded Flat correction pattern, indicating the potential for RMD to continue declining further.
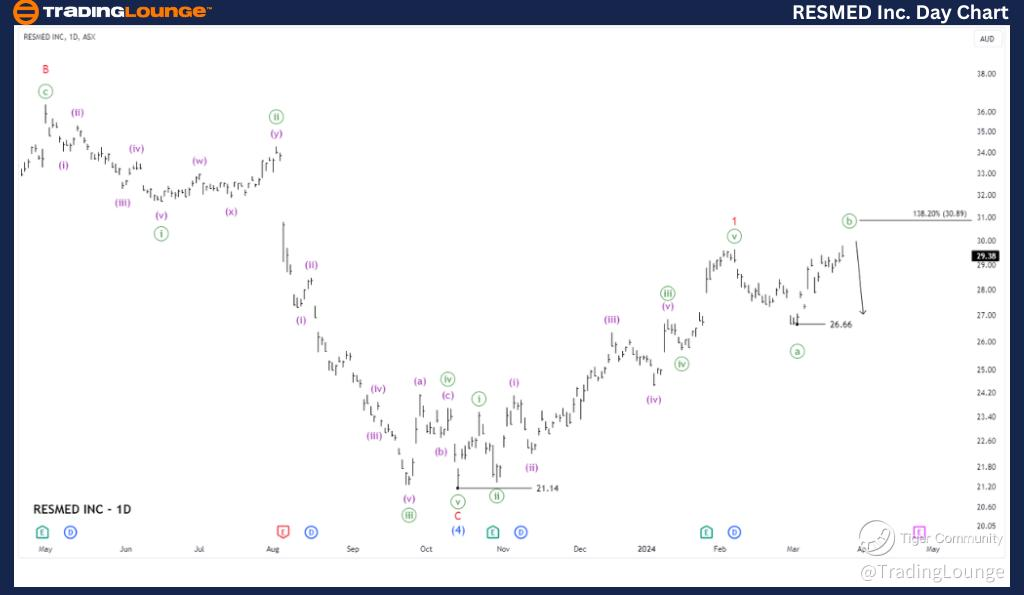
ASX: ResMed Inc one-day chart (semilog scale) analysis
Function: Major trend (Minor degree, red).
Mode: Motive.
Structure: Impulse.
Position: Wave ((c))-green of Wave 2-red.
Details: The short-term outlook indicates that wave 1-red has completed, and wave 2-red is unfolding as an Expanded Flat to push lower before wave 3-red resumes upward momentum. The downward movement seeks support around 26.66, and this bearish perspective will be maintained as long as the price remains below 30.90.
Invalidation point: 21.14.
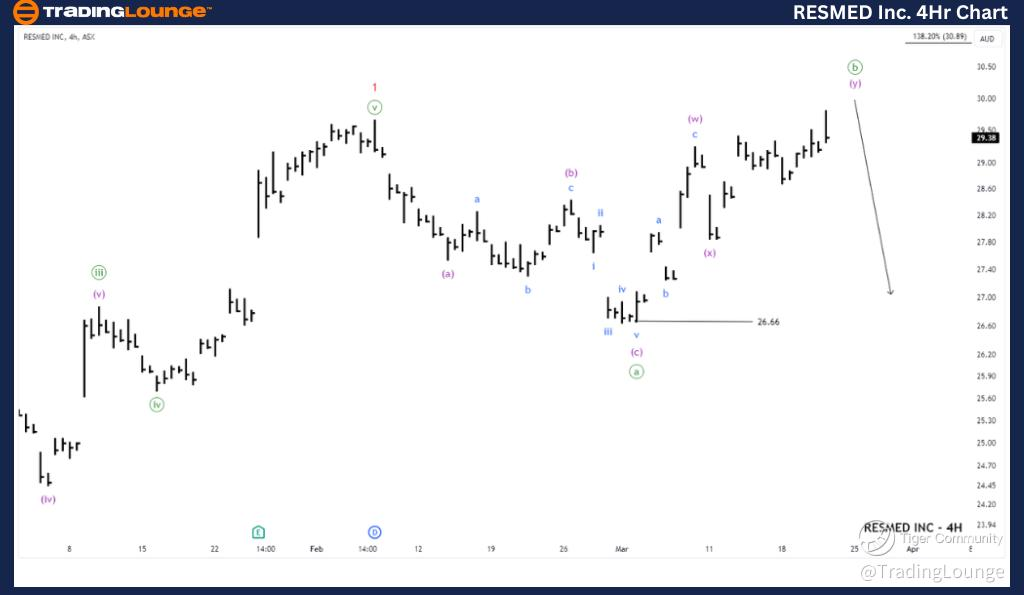
ASX: ResMed Inc four-hour chart analysis
Function: Counter trend (Minute degree, green).
Mode: Corrective.
Structure: Expanded Flat.
Position: Wave (y)-purple of Wave ((b))-green.
Details: The shorter-term outlook suggests that wave 2-red is unfolding as an Expanded Flat, where wave ((b))-green resembles a corrective wave and seems to be nearing completion. Wave ((c))-green may decline further, seeking support around 26.66. As long as the price remains below 30.89, this bearish perspective remains confident.
Invalidation point: Don’t know yet.
Conclusion
Our analysis, forecast of contextual trends, and short-term outlook for ASX: RMD – RESMED INC aim to provide readers with insights into the current market trends and how to capitalize on them effectively. We offer specific price points that act as validation or invalidation signals for our wave count, enhancing the confidence in our perspective. By combining these factors, we strive to offer readers the most objective and professional perspective on market trends.
ASX: ResMed Inc analysis [Video]
As with any investment opportunity there is a risk of making losses on investments that Trading Lounge expresses opinions on.
Historical results are no guarantee of future returns. Some investments are inherently riskier than others. At worst, you could lose your entire investment. TradingLounge™ uses a range of technical analysis tools, software and basic fundamental analysis as well as economic forecasts aimed at minimizing the potential for loss.
The advice we provide through our TradingLounge™ websites and our TradingLounge™ Membership has been prepared without considering your objectives, financial situation or needs. Reliance on such advice, information or data is at your own risk. The decision to trade and the method of trading is for you alone to decide. This information is of a general nature only, so you should, before acting upon any of the information or advice provided by us, consider the appropriateness of the advice considering your own objectives, financial situation or needs. Therefore, you should consult your financial advisor or accountant to determine whether trading in securities and derivatives products is appropriate for you considering your financial circumstances.
Recommended content
Editors’ Picks
EUR/USD climbs above 1.0900, looks to post weekly gains
![EUR/USD climbs above 1.0900, looks to post weekly gains](https://editorial.fxstreet.com/images/Markets/Currencies/Majors/EURUSD/money-59004818_XtraSmall.jpg)
EUR/USD gathers bullish momentum and trades above 1.0900 in the American session on Friday, looking to end the week in positive territory. The US Dollar remains under strong selling pressure following the disappointing jobs data, helping the pair push higher.
GBP/USD clings to daily gains near 1.2800 after weak US jobs data
![GBP/USD clings to daily gains near 1.2800 after weak US jobs data](https://editorial.fxstreet.com/images/Markets/Currencies/Majors/GBPUSD/iStock-689067954_XtraSmall.jpg)
GBP/USD clings to daily gains at around 1.2800 in the second half of the day on Friday. Nonfarm Payrolls in the US rose by 114,000 in July. This reading missed the market expectation of 175,000 by a wide margin and triggered a USD selloff.
Gold flirts with $2,480 after the weak NFP
![Gold flirts with $2,480 after the weak NFP](https://editorial.fxstreet.com/images/Markets/Commodities/Metals/Gold/Gold_Bar_XAU_Precious_Metal_XtraSmall.jpg)
Gold prices intensifies their bullish stance for the day, rising to the vicinity of the $2,475 region following the publication of the US labour market report for the month of July.
Bitcoin bounces off from the ascending trendline
![Bitcoin bounces off from the ascending trendline](https://editorial.fxstreet.com/images/Markets/Currencies/Cryptocurrencies/cryptocurrenciesusd_XtraSmall.jpg)
Bitcoin and Ethereum have retested their key support levels, with a break below these levels potentially signaling a bearish trend ahead. At the same time, Ripple shows resilience and could rally in the coming days after testing its key support level.
Week ahead – RBA and BoJ summary of opinions take center stage
![Week ahead – RBA and BoJ summary of opinions take center stage](https://editorial.fxstreet.com/images/Macroeconomics/CentralBanks/RBA/iStock-950974992_XtraSmall.jpg)
RBA decides on policy as hike bets disappear. BoJ Summary of Opinions awaited for more hike hints. After Fed, Dollar turns to ISM non-manufacturing PMI. New Zealand and Canada jobs data also on tap.