ASX Limited Elliott Wave technical forecast [Video]
![ASX Limited Elliott Wave technical forecast [Video]](https://editorial.fxstreet.com/images/TechnicalAnalysis/ChartPatterns/PointFigure/hand-drawing-stock-chart-63151915_XtraLarge.jpg)
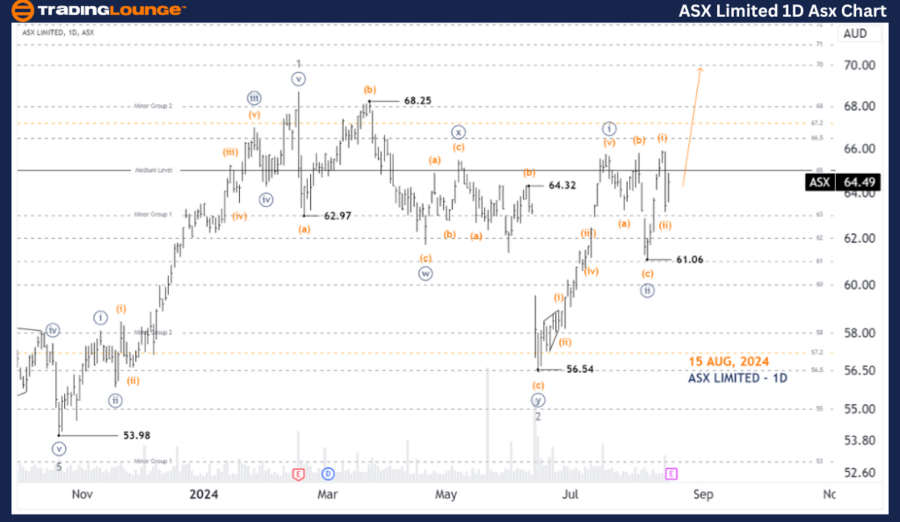
ASX: ASX LIMITED – ASX Elliott Elliott Wave Technical Analysis TradingLounge (1D Chart).
Greetings, Our Elliott Wave analysis today updates the Australian Stock Exchange (ASX) ASX LIMITED – ASX . We see that ASX Limited has just completed wave ((ii))-navy, and wave ((iii))-navy is returning to push higher.
ASX Limited Elliott Wave technical analysis
Function: Major (Minor degree, gray).
Mode: Motive.
Structure: Impulse.
Position: Wave (iii)-orange of Wave ((iii))-navy of Wave 3-grey.
Details: Wave ((ii))-Navy seems to have bottomed, and wave (iii)-the pattern of wave ((iii))-Navy is extending to push higher, while price must stay above the 63.15 low to maintain this view. We are approaching a Trading Setup with ASX Limited as support is coming from the 65.00 level.
Invalidation point: 63.15.
ASX one-day chart
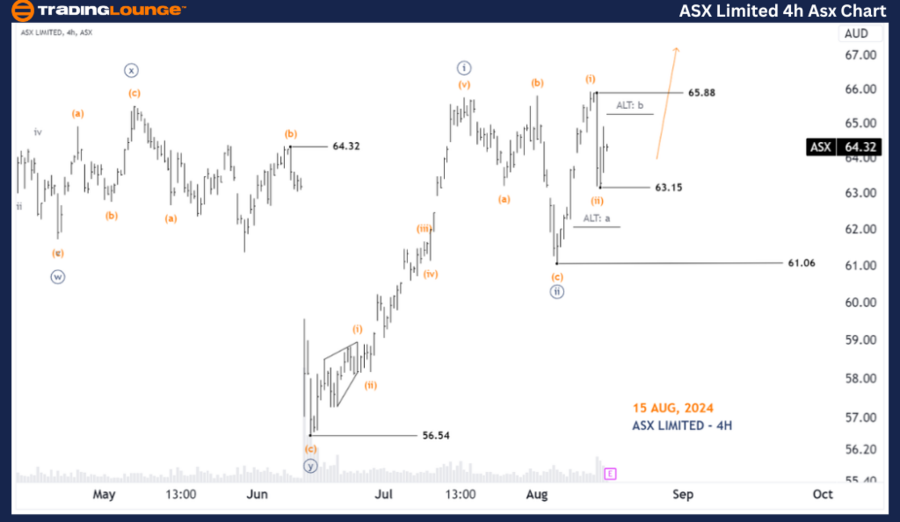
ASX Elliott Wave technical analysis
Function: Major Trend (Minute degree, navy).
Mode: Motive.
Structure: Impulse.
Position: Wave (iii)-orange of Wave ((ii))-navy.
Details: Wave (ii)-orange seems to have bottomed at the 63.15 low and wave (iii)-orange is unfolding to push higher. A push above 65.88 would further clarify that wave (iii)-orange of wave ((iii))-navy is active and prices will push higher. While prices must remain above the 63.15 low to maintain this view.
Invalidation point: 63.15.
Confirmation point: 65.88.
ASX four-hour chart analysis
Conclusion
Our analysis, forecast of contextual trends, and short-term outlook for ASX: ASX LIMITED – ASX aim to provide readers with insights into the current market trends and how to capitalize on them effectively. We offer specific price points that act as validation or invalidation signals for our wave count, enhancing the confidence in our perspective. By combining these factors, we strive to offer readers the most objective and professional perspective on market trends.
ASX Limited Elliott Wave technical forecast [Video]
Author

Peter Mathers
TradingLounge
Peter Mathers started actively trading in 1982. He began his career at Hoei and Shoin, a Japanese futures trading company.


