ASX Elliott Wave technical forecast [Video]
![ASX Elliott Wave technical forecast [Video]](https://editorial.fxstreet.com/images/Markets/Equities/Industries/Retailing/pic-pexels-artem-beliaikin-2292953-637435400820863972_XtraLarge.jpg)
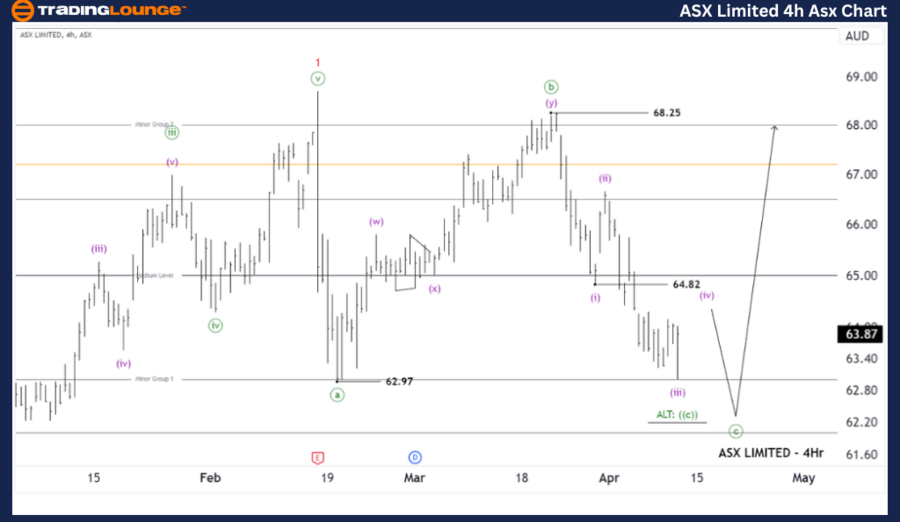
ASX: ASX LIMITED – ASX Elliott Elliott Wave Technical Analysis TradingLounge (1D Chart)
Greetings, Our Elliott Wave analysis today updates the Australian Stock Exchange (ASX) with ASX LIMITED – ASX. In our Top 50 ASX service, we accurately forecasted that ASX would decline with a corrective wave from near the high of $68.25 down to near $62.00. Now, this corrective wave appears to be nearing completion, so we have identified a good trading opportunity with ASX and are continuously monitoring.
ASX Elliott Wave technical analysis
ASX: ASX LIMITED – ASX 1D Chart (Semilog Scale) Analysis.
Function: Major (Minor degree, red).
Mode: Motive.
Structure: Impulse.
Position: Wave (c)-green of Wave 2-red.
Last forecast: The latest push lower forecast was correct.
Details: Short-term outlook suggests that wave 1-red has reached its peak, and wave 2-red is currently underway, expected to continue declining to lower levels. It will likely push further down towards the target around 62.97 before wave 3-red resumes to push higher again. With the support target identified or possibly pushed a little lower, I am waiting for a buying opportunity to set up.
Invalidation point: 68.25.
ASX: ASX LIMITED – ASX Elliott Wave Technical Analysis TradingLounge (4-Hour Chart).
ASX Elliott Wave technical analysis
ASX: ASX LIMITED – ASX 4-Hour Chart Analysis.
Function: Counter trend (Minute degree, green).
Mode: Corrective.
Structure: Flat.
Position: Wave (iv)-purple of Wave ((c))-green.
Details: The short-term outlook further indicates that the details of wave 2-red unfolding appear to resemble a Flat correction. Waves ((a))-green and ((b))-green have likely completed, and now wave ((c))-green also seems to be nearing completion. Wave ((c))-green is subdivided into waves (i)-(iii)-purple, which have likely finished. Now, it's time for wave (iv) to push slightly higher, followed by a potential decline in wave (v)-purple to push lower and complete the entire wave 2-red.
The alternative wave count suggests that wave 2-red may be completing as a ABC-green pattern. Regardless, I am closely monitoring ASX to prepare for a buying opportunity.
Invalidation point: 64.82.
Conclusion:
Our analysis, forecast of contextual trends, and short-term outlook for ASX: ASX LIMITED – ASX aim to provide readers with insights into the current market trends and how to capitalize on them effectively. We offer specific price points that act as validation or invalidation signals for our wave count, enhancing the confidence in our perspective. By combining these factors, we strive to offer readers the most objective and professional perspective on market trends.
ASX Elliott Wave technical analysis [Video]
Author

Peter Mathers
TradingLounge
Peter Mathers started actively trading in 1982. He began his career at Hoei and Shoin, a Japanese futures trading company.


