ASX: SOUTH32 LIMITED – S32 Elliott Wave Technical Analysis TradingLounge (1D Chart).
Greetings,
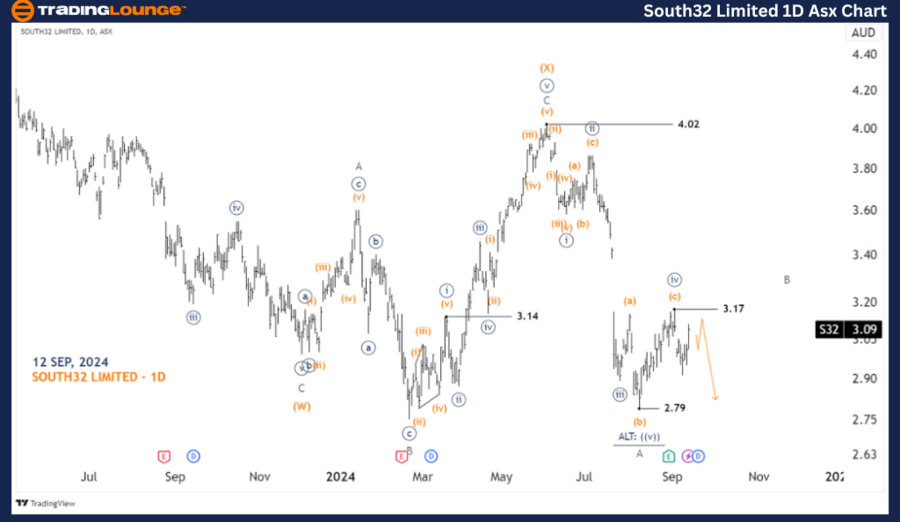
Today's Elliott Wave analysis provides an update on the Australian Stock Exchange (ASX) SOUTH32 LIMITED – S32. We observe S32 continuing to decline within the (Y)-orange wave.
ASX: SOUTH32 LIMITED – S32 Elliott Wave technical analysis
ASX: SOUTH32 LIMITED – S32 1D Chart (Semilog Scale) Analysis.
-
Function: Major trend (Minor degree, grey).
-
Mode: Motive.
-
Structure: Impulse.
-
Position: Wave ((v))-navy of Wave A-grey.
-
Details: The ((v))-navy wave seems to be pushing lower. However, if the price rises above 3.17, it would signal that the ((v))-navy wave concluded earlier than anticipated, completing the five-wave sequence (Wave A-grey). At that point, a larger corrective wave (Wave B-grey) would unfold, pushing prices higher.
-
Invalidation point: 3.17.
ASX: SOUTH32 LIMITED – S32 Elliott Wave Technical Analysis TradingLounge (4-Hour Chart)
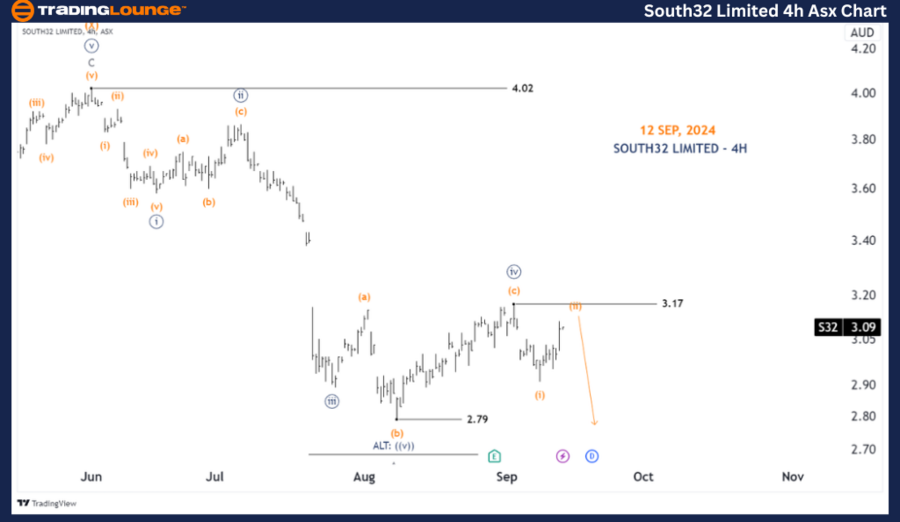
ASX: SOUTH32 LIMITED – S32 four-hour chart analysis
-
Function: Major Trend (Minute degree, navy).
-
Mode: Motive.
-
Structure: Impulse.
-
Position: Wave (ii)-orange of Wave ((v))-navy.
-
Details: Wave ((iv))-navy appears to have completed as an Expanded Flat. Now, Wave ((v))-navy seems to be unfolding and pushing lower. However, there is weakness in this count, with recent price action nearing the 3.17 level. Should the price exceed this point, a reassessment of the situation would be necessary.
-
Invalidation point: 3.17.
Conclusion
Our analysis and forecast for ASX: SOUTH32 LIMITED – S32 offer insights into the ongoing market trends, guiding traders on how to capitalize on these movements. We provide clear price points as validation or invalidation signals for our wave counts, strengthening confidence in our analysis. Combining these factors allows us to present an objective and professional perspective on the current market conditions.
Technical analyst: Hua (Shane) Cuong, CEWA-M (Master’s Designation).
ASX: SOUTH32 LIMITED – S32 Elliott Wave technical analysis [Video]
As with any investment opportunity there is a risk of making losses on investments that Trading Lounge expresses opinions on.
Historical results are no guarantee of future returns. Some investments are inherently riskier than others. At worst, you could lose your entire investment. TradingLounge™ uses a range of technical analysis tools, software and basic fundamental analysis as well as economic forecasts aimed at minimizing the potential for loss.
The advice we provide through our TradingLounge™ websites and our TradingLounge™ Membership has been prepared without considering your objectives, financial situation or needs. Reliance on such advice, information or data is at your own risk. The decision to trade and the method of trading is for you alone to decide. This information is of a general nature only, so you should, before acting upon any of the information or advice provided by us, consider the appropriateness of the advice considering your own objectives, financial situation or needs. Therefore, you should consult your financial advisor or accountant to determine whether trading in securities and derivatives products is appropriate for you considering your financial circumstances.
Recommended content
Editors’ Picks

EUR/USD hovers above 1.1000 ahead of ECB policy announcements
EUR/USD is gyrating in a tight range above 1.1000 in Asian trading on Thursday. Traders assess the latest US CPI inflation data, bracing for the ECB policy announcements amid a positive risk sentiment and sustained US Dollar strength.

GBP/USD recovers to 1.3050, US data in focus
GBP/USD is recovering from three-week lows to trade near 1.3050 in the European morning on Thursday. The pair is underpinned by persisting risk flows and a pause in the US CPI-led Dollar rebound. The focus now shifts to the US PPI inflation data.

Gold price struggles to capitalize on modest intraday uptick amid stronger US Dollar
Gold price (XAU/USD) trims a part of its modest intraday gains, albeit manages to hold its neck comfortably above the $2,500 psychological mark through the early European session on Thursday.

European Central Bank widely expected to cut interest rates in September
The European Central Bank is expected to cut key rates by 25 bps at the September policy meeting. ECB President Christine Lagarde’s presser and updated economic forecasts will be closely scrutinized for fresh policy cues.

Uniswap price is poised for a rally if it breaks above the ascending triangle pattern
Uniswap price trades inside an ascending triangle pattern; a breakout signals a rally ahead. This bullish move is further supported by UNI’s on-chain data, which shows a negative Exchange Flow Balance and decreasing exchange supply, hinting at a rally ahead.

Moneta Markets review 2024: All you need to know
VERIFIED In this review, the FXStreet team provides an independent and thorough analysis based on direct testing and real experiences with Moneta Markets – an excellent broker for novice to intermediate forex traders who want to broaden their knowledge base.