ASX – CSL Limited (CSL) Elliott Wave technical analysis [Video]
![ASX – CSL Limited (CSL) Elliott Wave technical analysis [Video]](https://editorial.fxstreet.com/images/Markets/Equities/Industries/CommunicationServices/mobile-phone-637435389695511071_XtraLarge.jpg)
Unlocking ASX Trading Success: CSL Limited (CSL) Stock Analysis & Elliott Wave Technical Forecast.
ASX – CSL LIMITED (CSL) Elliott Elliott Wave Technical Analysis TradingLounge (1D Chart), 20 March 24.
Greetings, Our Elliott Wave analysis today updates the Australian Stock Exchange (ASX) with CSL Limited (CSL) shares. We have identified a Triangle correction pattern, indicating the potential for CSL to continue declining further. Today's update shows the potential for execution of trading opportunities.
ASX – CSL Limited (CSL) Elliott Wave technical analysis
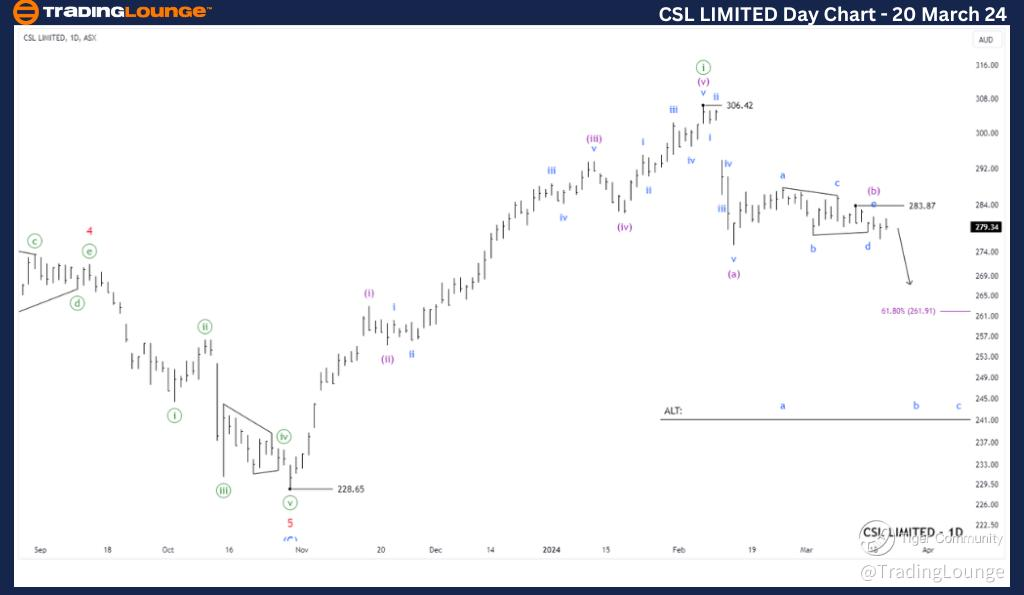
CSL LIMITED (ASX): CSL 1D Chart (Semilog Scale) Analysis.
Function: Major (Minute degree, green).
Mode: Motive.
Structure: Impulse.
Position: Wave (c)-purple of Wave ((ii))-green.
Details: The short-term outlook indicates that wave ((i))-green has concluded, and wave ((ii))-green is currently unfolding as a Zigzag correction. Wave (a)-purple appears to have ended, and wave (b)-purple likely as well. Therefore, wave (c)-purple is now unfolding to decline further towards the immediate target at 261.91, while prices must consistently remain below 283.87.
Invalidation point: 283.87.
Elliott Wave Analyst: Hua (Shane) Cuong, CEWA-M (Master’s Designation).
ASX – CSL LIMITED (CSL) Elliott Elliott Wave Technical Analysis TradingLounge (4-Hour Chart), 20 March 24.
CSL Limited (ASX): CSL Elliott Wave technical analysis
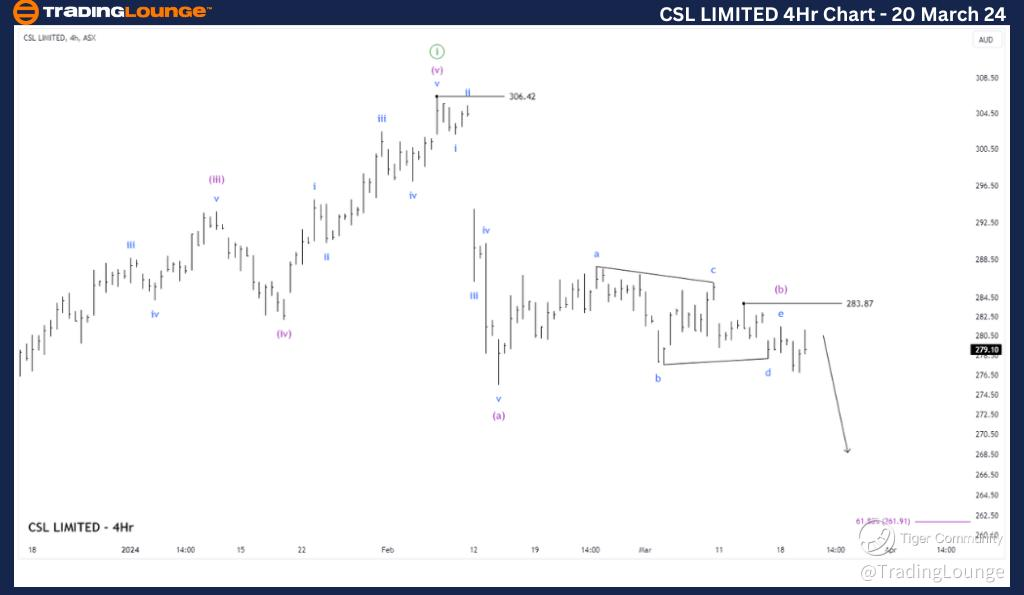
CSL LIMITED (ASX): CSL 4-Hour Chart Analysis.
Function: Counter trend (Minuette degree, purple).
Mode: Corrective.
Structure: Zigzag.
Position: Wave (c)-purple.
Details: The short-term outlook (4H Chart) suggests that wave (b)-purple may have concluded with the Triangle Correction and is now primed for a decline with wave (c)-purple. The target for this decline is around 261.91, or possibly lower, while prices consistently remain below the high at 283.87.
Invalidation point: 283.87.
Conclusion:
Today's update will continue with the forecast made on 18 March 2024, to provide potential perspectives on trading opportunities with ASX:CSL.
Our analysis, forecast of contextual trends, and short-term outlook for ASX: CSL LIMITED (CSL) aim to provide readers with insights into the current market trends and how to capitalize on them effectively. We offer specific price points that act as validation or invalidation signals for our wave count, enhancing the confidence in our perspective. By combining these factors, we strive to offer readers the most objective and professional perspective on market trends.
ASX – CSL Limited (CSL) Elliott Wave technical analysis [Video]
Author

Peter Mathers
TradingLounge
Peter Mathers started actively trading in 1982. He began his career at Hoei and Shoin, a Japanese futures trading company.


