Asian Paints Elliott Wave technical analysis [Video]
![Asian Paints Elliott Wave technical analysis [Video]](https://editorial.fxstreet.com/images/TechnicalAnalysis/ChartPatterns/Chartism/stock-market-ticker-board-black-17803444_XtraLarge.jpg)
Asian Paints Elliott Wave technical analysis
Function: Counter Trend Lower (Minor Degree Grey).
Mode: Corrective.
Structure: Flat (3-3-5).
Position: Minute Wave C.
Details: A Minor degree corrective wave A-B-C is unfolding against 3550 with A and B in place already. High probable count suggests Minute Wave C is now complete or near to completion.
Invalidation point: 3410.
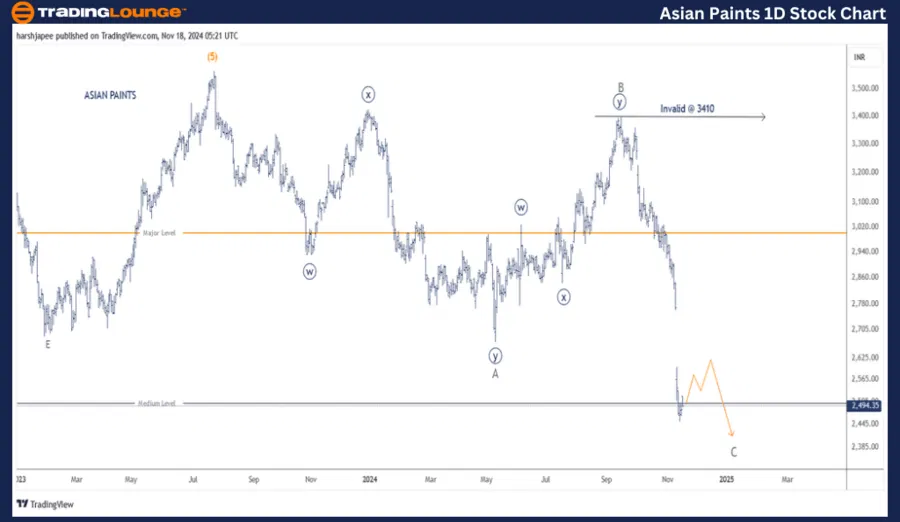
Asian Paints daily chart technical analysis and potential Elliott Wave counts
ASIAN PAINTS daily chart is indicating that Minor degree A-B-C correction could be complete around 2450 or near to completion. Also note that fibonacci extension is pointing towards 2330 mark for Minute Wave ((v)) of C to terminate.
Earlier, the stock had terminated Intermediate Wave (5) Orange around the 3570 mark. The subsequent drop could be marked as Minor Wave A-B-C as a flat towards 2450 low. If the above is correct, bulls would be back in control soon from current levels.
Asian Paints Elliott Wave technical analysis
Function: Counter Trend Lower (Minor Degree Grey).
Mode: Corrective.
Structure: Flat (3-3-5).
Position: Minute Wave C.
Details: A Minor degree corrective wave A-B-C is unfolding against 3550 with A and B in place already. High probable count suggests Minute Wave C is now complete or near to completion. Minute Wave ((iii)) Navy of C might have extended; potential Wave ((iv)) could unfold, before one more low to terminate Minor Wave C.
Invalidation point: 3410.
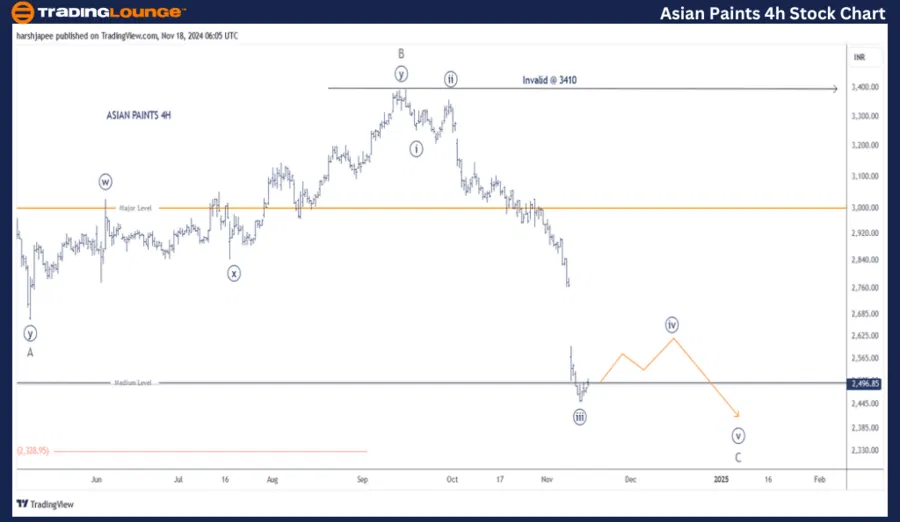
Asian Paints four-hour chart technical analysis and potential Elliott Wave counts
ASIAN PAINTS 4H chart is highlighting the sub waves within Minor Wave C, which might be complete around 2450 or needs another low to terminate. High probable count suggests Minute Wave ((iii)) of C is an extension, which leads to Minute Wave ((iv)) to unfold soon.
Once complete, bears might drag one last time to terminate Wave ((v)) of C below 2450 mark.
Conclusion
ASIAN PAINTS is progressing within Minor Wave C Grey with A-B-C correction and might terminate below 2450. Also note that the entire corrective wave from 3570 could be complete of it is a part of a larger degree corrective wave.
Asian Paints Elliott Wave technical analysis [Video]
Author

Peter Mathers
TradingLounge
Peter Mathers started actively trading in 1982. He began his career at Hoei and Shoin, a Japanese futures trading company.


