Are stocks still forming a top?

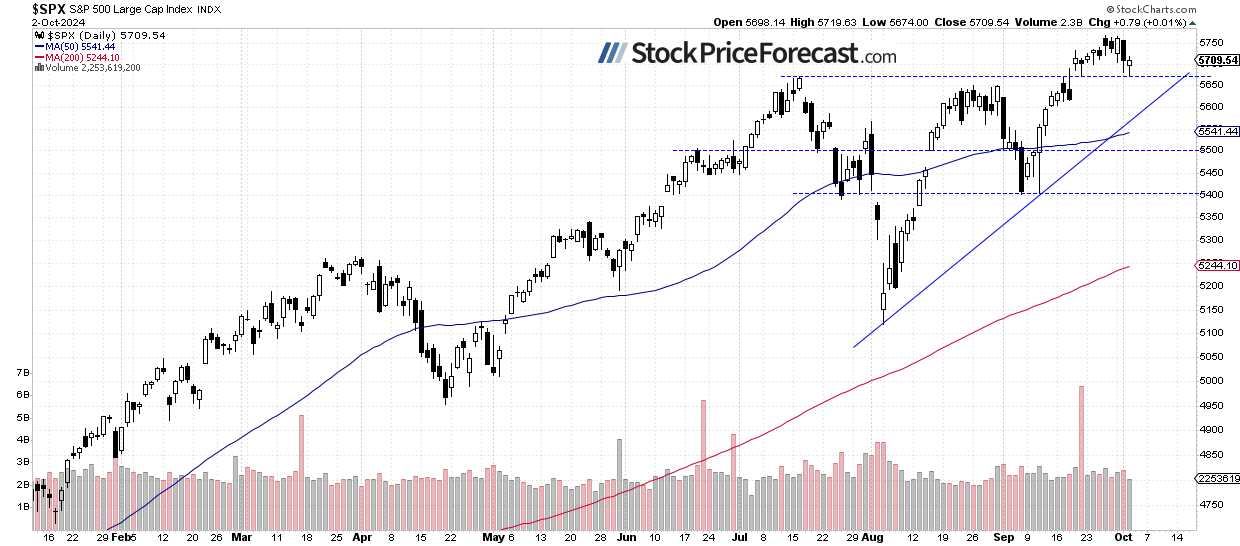
Stock prices were little changed on Wednesday, with the S&P 500 index closing 0.01% higher after rebounding from the daily low of 5,674. The market dipped below 5,700, slightly extending Tuesday’s decline of 0.9%. On Tuesday, I mentioned that the market “may see some more short-term uncertainty and a sideways trading action.”, and it’s proving correct. This morning, the S&P 500 is likely to open 0.1% lower, as indicated by futures contracts. The sentiment remained unchanged following a slightly higher-than-expected Unemployment Claims release.
Investor sentiment slightly worsened, as shown by yesterday’s AAII Investor Sentiment Survey, which reported that 45.5% of individual investors are bullish, while 27.3% of them are bearish, up from 23.7% last week.
The S&P 500 rebounded from its mid-July high yesterday, as we can see on the daily chart.
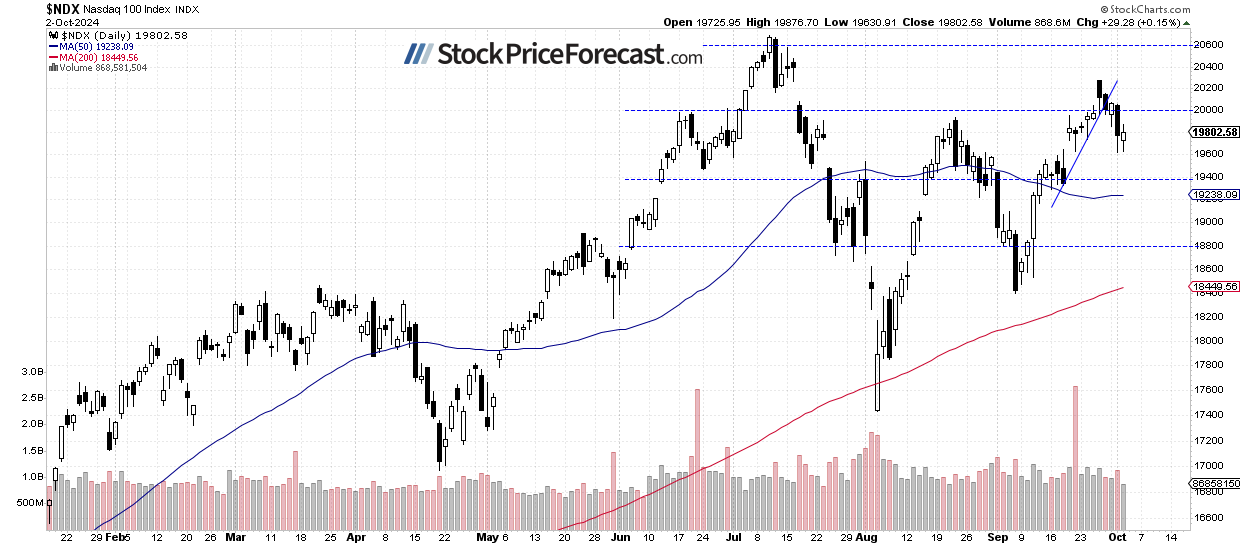
Nasdaq 100: Consolidation following Tuesday’s decline
The Nasdaq 100 gained 0.15% on Wednesday, retracing some of Tuesday’s 1.4% decline. Recently, it pulled back from the resistance at 20,250; on Tuesday, it traded as low as 19,622. This morning, the Nasdaq 100 is expected to open 0.1% lower.
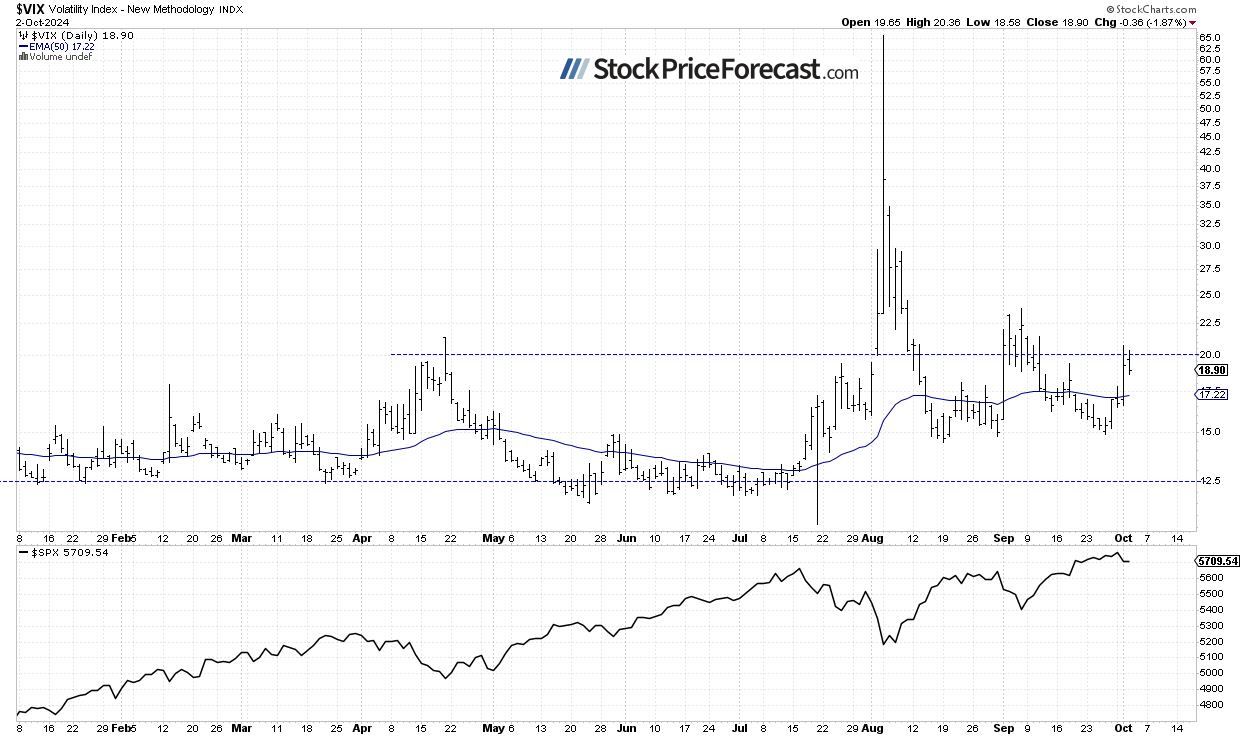
VIX remains near 20.00
On September 6, the VIX index, a measure of market fear, reached a local high of 23.76. It was indicating elevated fear among investors. However, a stock rebound followed by a record-breaking rally pushed the VIX lower. Last Thursday, it fell to 14.90, its lowest level since late August. However, with stock prices pulling back on Tuesday, the VIX jumped back to around 20, reaching a local high of 20.73.
Historically, a dropping VIX indicates less fear in the market, and rising VIX accompanies stock market downturns. However, the lower the VIX, the higher the probability of the market’s downward reversal. Conversely, the higher the VIX, the higher the probability of the market’s upward reversal.
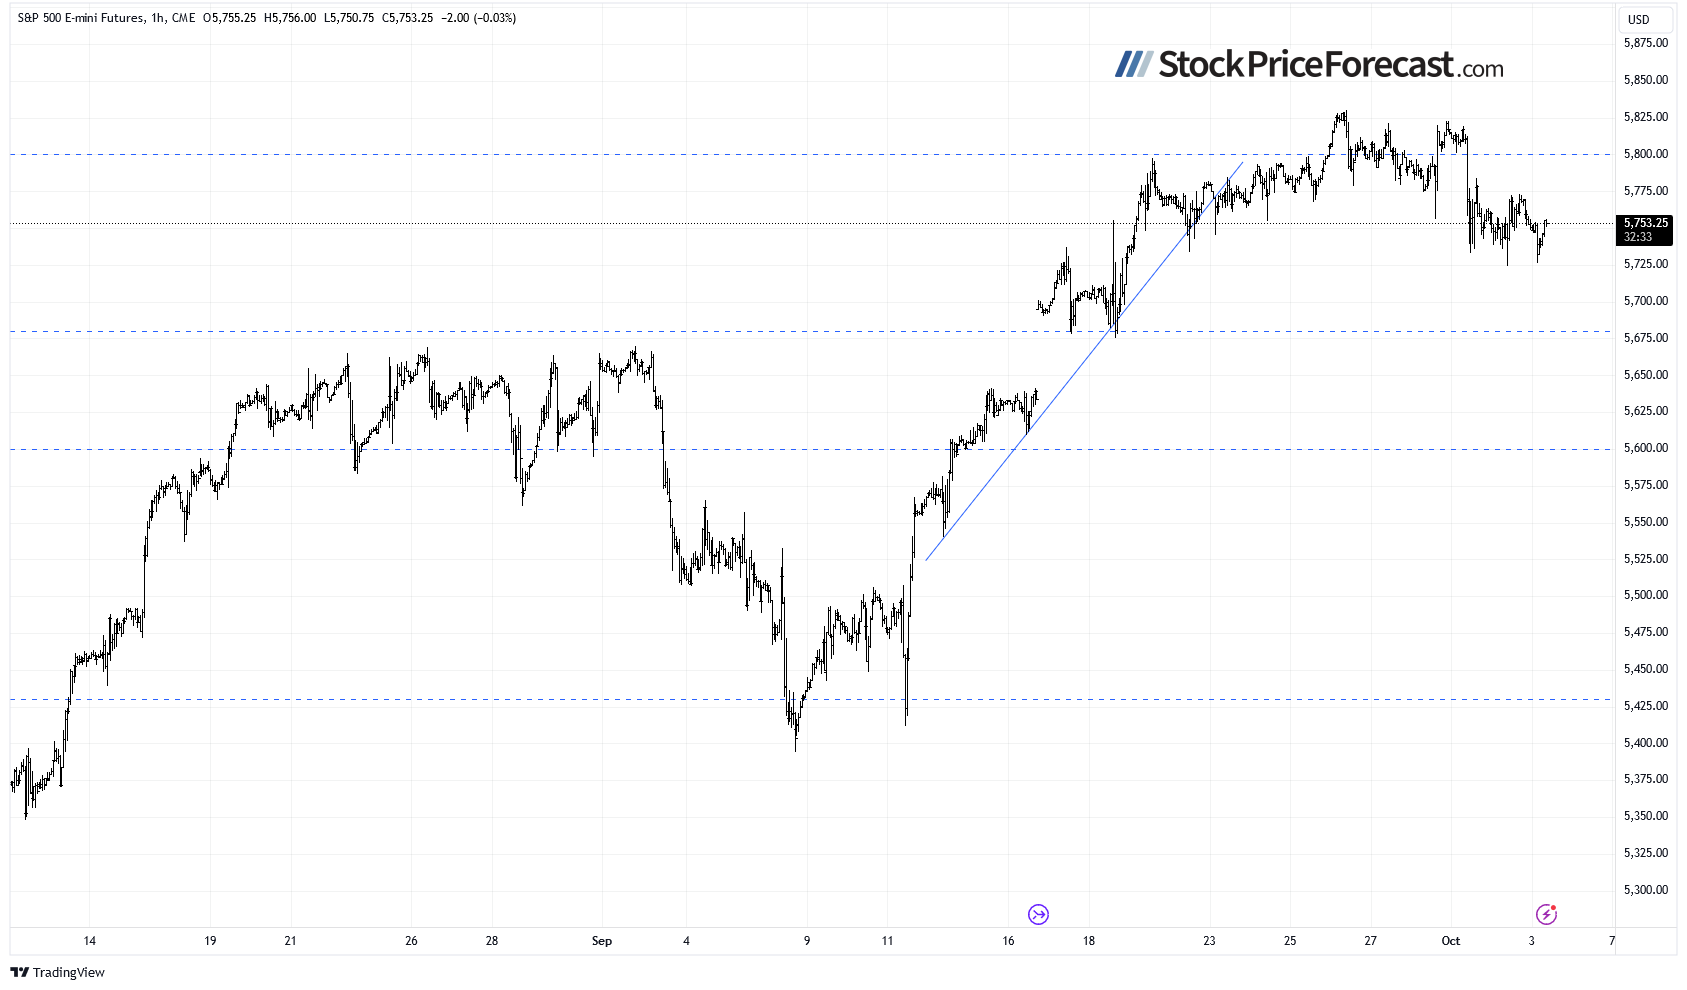
S&P 500 futures contract: Moving sideways again
Let’s take a look at the hourly chart of the S&P 500 futures contract. Since Tuesday’s drop, the market has been moving sideways, trading within another consolidation phase. The support level is around 5,725, with the next one at 5,680–5,700, marked by mid-September fluctuations. The market may still be in a topping pattern ahead of a potential correction. Resistance remains at 5,780–5,800.
Conclusion
Tuesday's trading session brought back some pessimism as markets reacted to news of the Israel-Iran conflict. However, yesterday, the market traded mostly sideways, and the S&P 500 extended its consolidation above its mid-July local high of around 5,670.
On Tuesday, I wrote “The key question is whether the uptrend will continue despite overbought conditions. While no clear negative signals have appeared, the rally seems overstretched.” The question remains: is this a topping pattern before some more meaningful downward correction or just a consolidation before another leg up?
I opened a speculative short position in the S&P 500 futures contract on September 16.
In my Stock Price Forecast for October 2024, I wrote “the market extended its uptrend in September after rebounding from the early August low. No clear negative signals have surfaced; however, a correction could still occur. Historically, October is a seasonally weak month, especially during its first weeks. Will the stock market sell off soon? Although monetary policy easing supports the bulls, uncertainty surrounding geopolitical risks and the upcoming presidential election may still weaken sentiment.”
For now, my short-term outlook remains bearish.
Here’s the breakdown:
-
The S&P 500 is likely to continue consolidating following Tuesday’s pullback.
-
The market may still be forming a topping pattern before a downward correction.
-
In my opinion, the short-term outlook is bearish.
Want free follow-ups to the above article and details not available to 99%+ investors? Sign up to our free newsletter today!
Want free follow-ups to the above article and details not available to 99%+ investors? Sign up to our free newsletter today!
Author

Paul Rejczak
Sunshine Profits
Paul Rejczak is a stock market strategist who has been known for the quality of his technical and fundamental analysis since the late nineties.


