Are stock prices reaching medium-term highs?

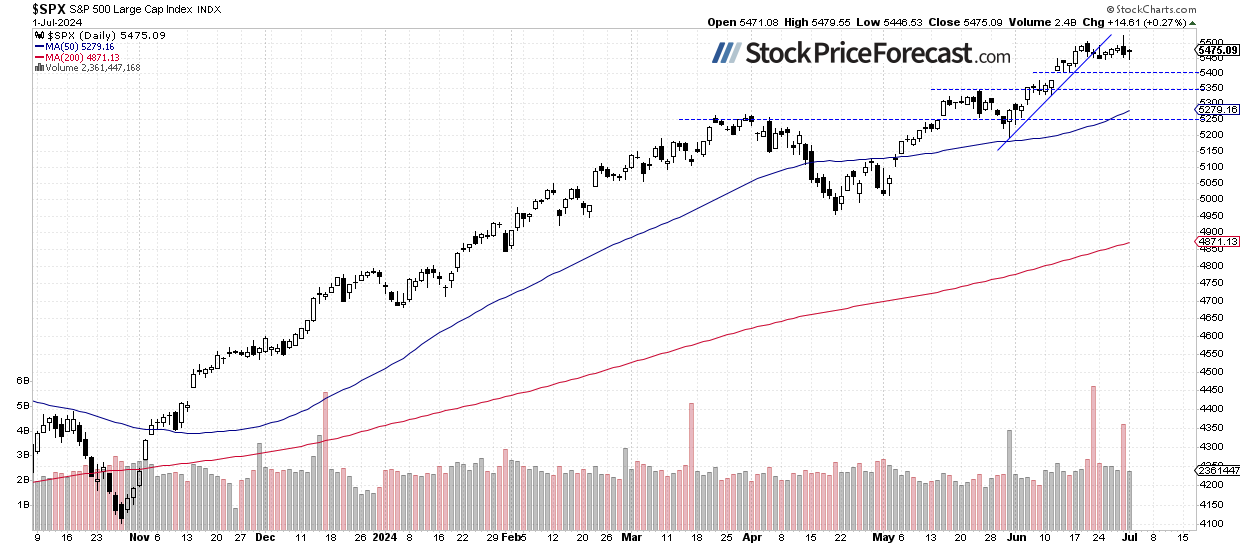
Monday’s trading session didn’t change much, with the S&P 500 index gaining 0.27% and extending a short-term consolidation, remaining relatively close to a new record high reached on Friday at 5,523.64. It still looks like a flat correction within an uptrend. Are there any signs that may point to a more meaningful downward correction?
As I mentioned in my stock price forecast for July yesterday, “While more advances remain likely, the likelihood of a deeper downward correction also rises. Overall, there have been no confirmed negative signals so far, but the May gain of 4.8% and June gain of 3.5% suggest a more cautionary approach for July (…) The market will be waiting for the quarterly earnings season in the second half of the month. Plus, there will be a series of economic data, including the CPI release on July 11, the Advance GDP number on July 25, and the FOMC Rate Decision on July 31.”
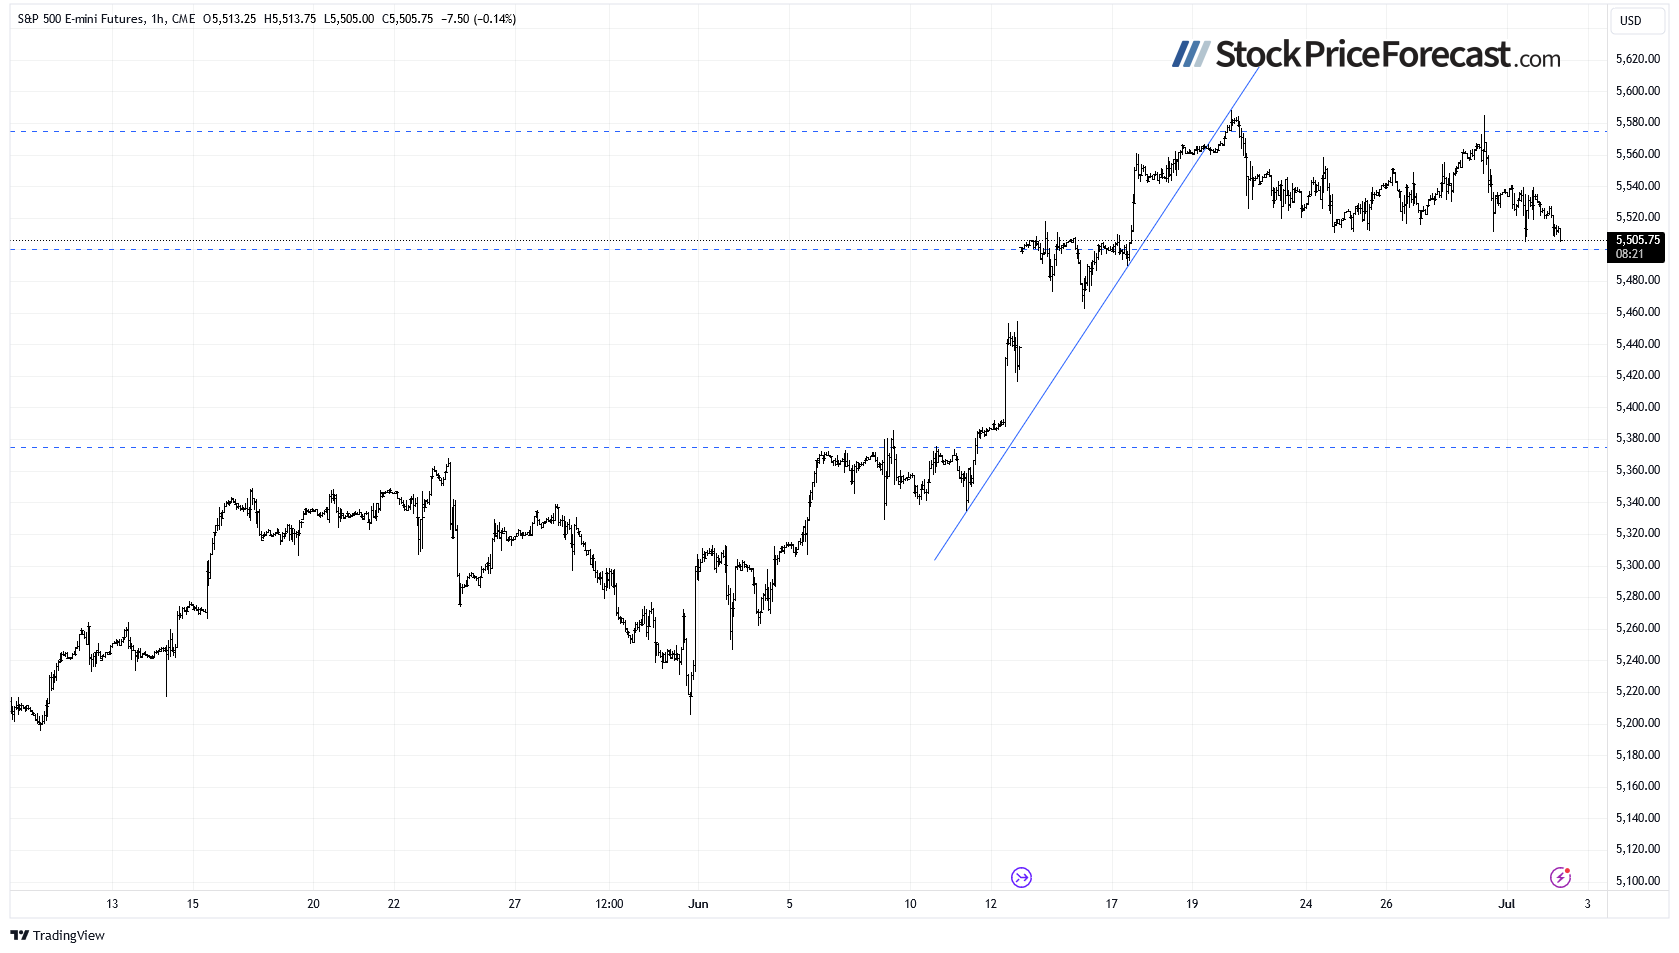
This morning, the S&P 500 is likely to open 0.5% lower, as indicated by futures contracts. So, it may see more short-term uncertainty, and possibly more profit-taking action. For now, it still looks like consolidation within an uptrend though.
Last week, the investor sentiment remained basically unchanged, as indicated by the AAII Investor Sentiment Survey on Wednesday, which showed that 44.5% of individual investors are bullish, while 28.3% of them are bearish (up from last week's reading of 22.5%). The AAII sentiment is a contrary indicator in the sense that highly bullish readings may suggest excessive complacency and a lack of fear in the market. Conversely, bearish readings are favorable for market upturns.
The S&P 500 index continues sideways after breaking its upward trend line last week, as we can see on the daily chart.
Nasdaq 100 remains below 20,000
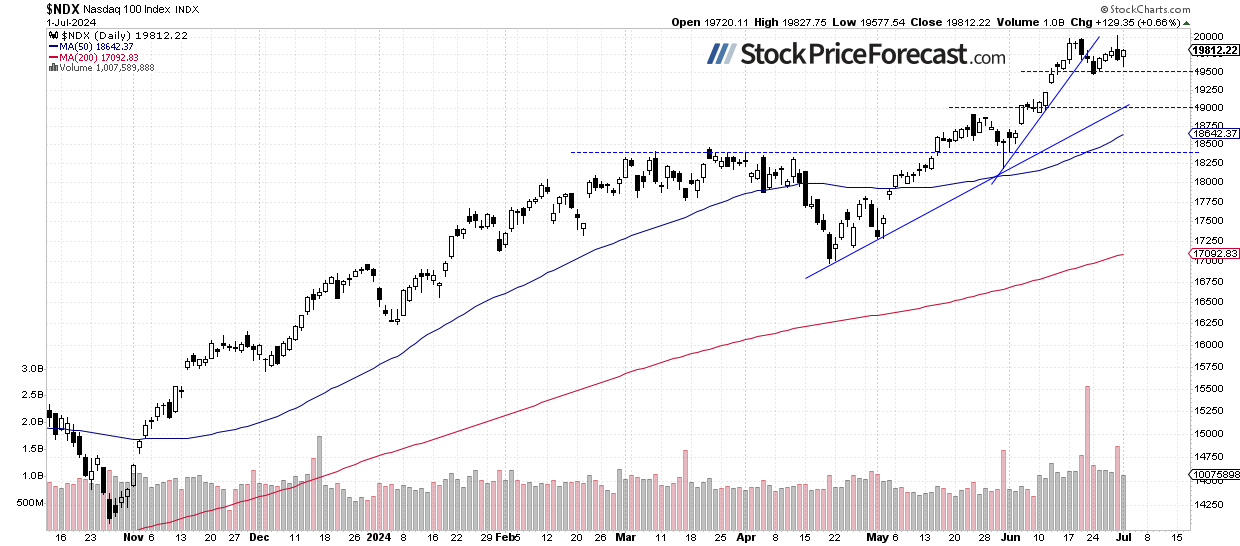
On Friday, the technology-focused Nasdaq 100 index reached a new record high of 20,017.71, before retracing the advance and closing slightly lower. It basically extended a consolidation following the first half of June rally. This morning, the Nasdaq 100 is expected to open 0.6% lower, retracing yesterday’s advance of 0.66%.
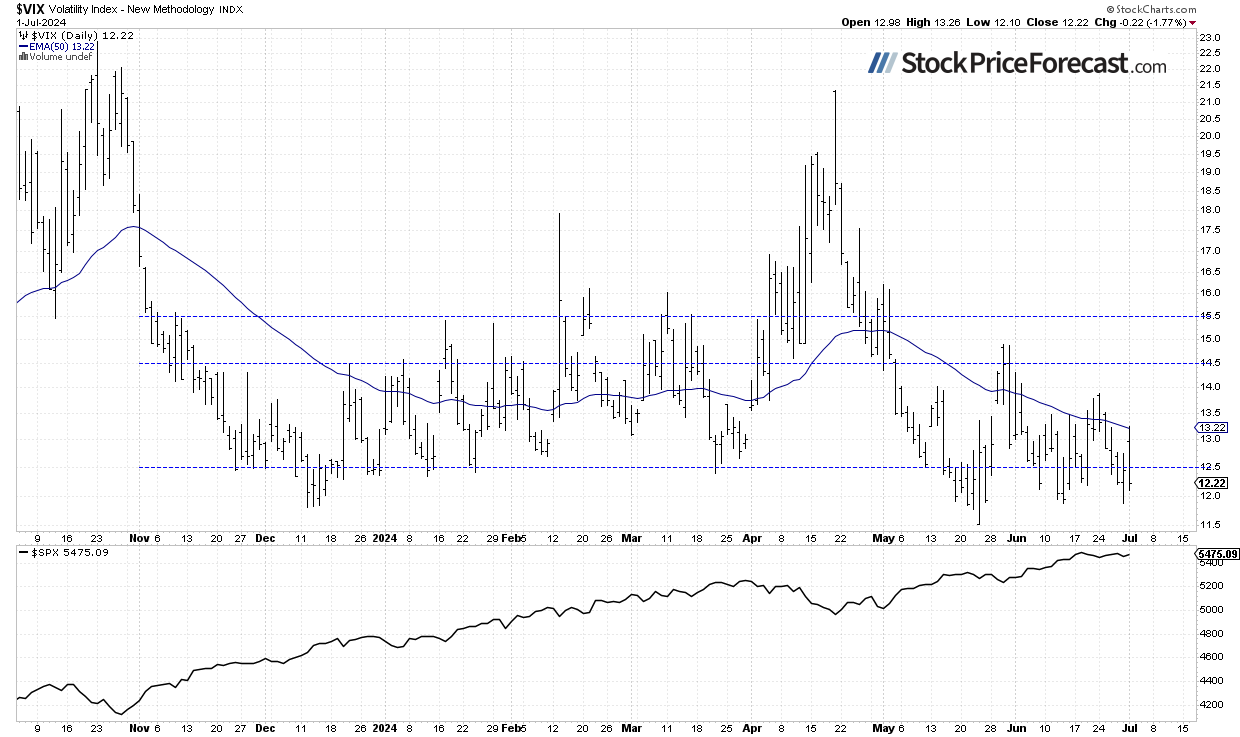
VIX is still close to 12
The VIX index, also known as the fear gauge, is derived from option prices. In late May, it set a new medium-term low of 11.52 before rebounding up to around 15 on correction worries. Since the previous Thursday, it has been closing above the 13 level, showing increasing fear in the market, but on Friday, it dipped to a local low of 11.87. Yesterday, the VIX closed slightly above 12, which means that there is basically no fear in the market.
Historically, a dropping VIX indicates less fear in the market, and rising VIX accompanies stock market downturns. However, the lower the VIX, the higher the probability of the market’s downward reversal.
Futures contract is closer to 5,500
Let’s take a look at the hourly chart of the S&P 500 futures contract. This morning, it’s trading closer to the 5,500 level after retracing its yesterday’s rebound. The market may be forming a topping pattern; however, the support level is still around 5,500.
Conclusion
Stocks are likely to open lower this morning, retracing their yesterday’s advances as there is growing uncertainty about a possible correction amid the coming economic data and earnings releases. The risk of a downward correction is increasing; however, it still looks like a flat correction of the uptrend.
Quoting my yesterday’s stock price forecast for July, “Investors continue pricing in the Fed’s monetary policy easing that is supposed to happen this year. Hence, a medium-term downward reversal still seems a less likely scenario. However, the recent record-breaking rally may be a cause for some short-term concern as a downward correction may be coming.”
For now, my short-term outlook remains neutral.
Here’s the breakdown:
-
The S&P 500 extends a consolidation as it remains relatively close to a new record high from Friday.
-
Investors are waiting for more economic data and the coming quarterly earnings season.
-
In my opinion, the short-term outlook is neutral.
Want free follow-ups to the above article and details not available to 99%+ investors? Sign up to our free newsletter today!
Want free follow-ups to the above article and details not available to 99%+ investors? Sign up to our free newsletter today!
Author

Paul Rejczak
Sunshine Profits
Paul Rejczak is a stock market strategist who has been known for the quality of his technical and fundamental analysis since the late nineties.


