Apple Stock Price: Should I buy Apple stock now? AAPL technical chart levels to watch
- Apple shares have a slow Wednesday as AAPL underperforms the broader market.
- AAPL launches new products on April 20.
- Apple stock price looking to break moving average support.

Apple really needs no introduction. If you do not know what Apple (AAPL) is, well, then you certainly should not be thinking about investing in it.
Stay up to speed with hot stocks' news!
Apple stock price news
Apple had a virtual launch event on April 20 where it announced a slew of new products. AAPL announced a new slim line of iMacs and new higher-quality iPads with enhanced Apple processors. Apple has been transitioning to using its own processors and moving away from Intel.
Should I buy Apple stock?
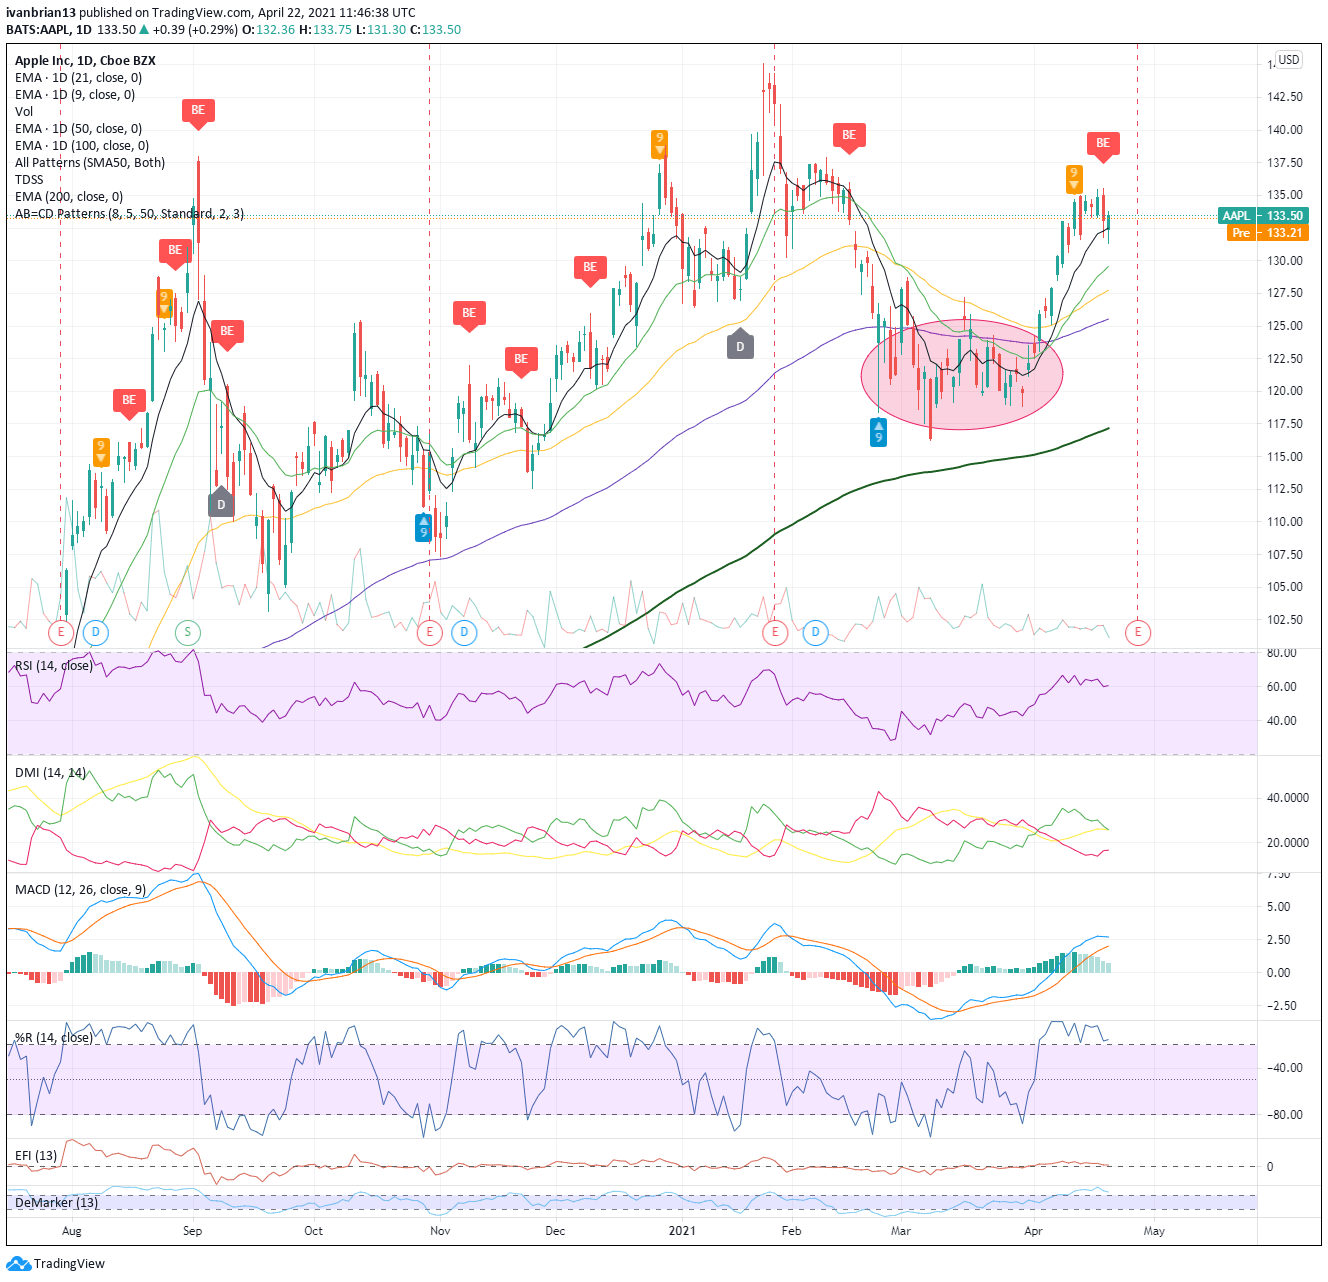
The daily chart for Apple has seen a strong recent uptrend from the lows in late March. This move has been nicely held up by the 9-day moving average. This is currently right where Apple finds itself, sitting on the 9-day moving average. This level is key to short-term traders. A break of this will see Apple shares target the 21-day moving average support at $129.57.
Intermediate support comes further at $127.74 and $125.54, the longer term 50 and 100-day moving averages. Neither of these levels have held the trend, hence the levels are not as strong. what is clear from the chart is how well the 9 and 21-day averages have worked in terms of support and resistance levels.
The bearish focus has been enhanced by the recent bearish engulfing candle on April 20. A bearish engulfing candle, for those not familiar, is a candle where the close is toward the end of the daily range indicating sentiment became more negative as the trading session progressed. Negativity increased through the day with AAPL shares closing near the low price for the day and a long way from the high price.
The Relative Strength Index (RSI) is in neutral territory, but the Williams oscillator is showing overbought values. Both of these indicators look to identify when a share price has moved into overbought or oversold conditions. The RSI and William Oscillator compare prices against momentum looking for periods of oversold or overbought conditions, essentially stretched prices. Apple is also showing a version of the Demark 9 sell signal. This is a sequential system that tries to identify price exhaustion in a strong trend.
Any break lower will see Apple shares target the previous consolidation area shown in the red bubble. Volume in this area was much higher than recently, showing the battle between bulls and bears before the price eventually broke out. The breakout has seen volumes reduce, so this would logically be an area where Apple shares would again find support.
As we can see from the chart, earnings are due shortly, which should give further clarity to the overall view. Apple will report Q1 earnings on April 28. EPS is expected to be $0.98 with revenue of $77.1 billion.
At the time of writing, the author has no position in any stock mentioned in this article and no business relationship with any company mentioned. The author has not received compensation for writing this article, other than from FXStreet.
This article is for information purposes only. The author and FXStreet are not registered investment advisors and nothing in this article is intended to be investment advice. It is important to perform your own research before making any investment and take independent advice from a registered investment advisor.
FXStreet and the author do not provide personalized recommendations. The author makes no representations as to accuracy, completeness, or the suitability of this information. FXStreet and the author will not be liable for any errors, omissions or any losses, injuries or damages arising from this information and its display or use. The author will not be held responsible for information that is found at the end of links posted on this page.
Errors and omissions excepted.
Premium
You have reached your limit of 3 free articles for this month.
Start your subscription and get access to all our original articles.
Author

Ivan Brian
FXStreet
Ivan Brian started his career with AIB Bank in corporate finance and then worked for seven years at Baxter. He started as a macro analyst before becoming Head of Research and then CFO.


