|

Apple stock (AAPL) Elliott Wave : Buying the dips at the blue box area

In this technical article we’re going to take a quick look at the weekly Elliott Wave charts of Apple Stock (AAPL) , published in members area of the website. As many of our members are aware, the stock has given us good buying opportunities recently. AAPL hit our buying zone and completed a correction at the Equal Legs (Blue Box Area). In the following sections, we’ll delve into the Elliott Wave pattern and our trading setup for further insight.

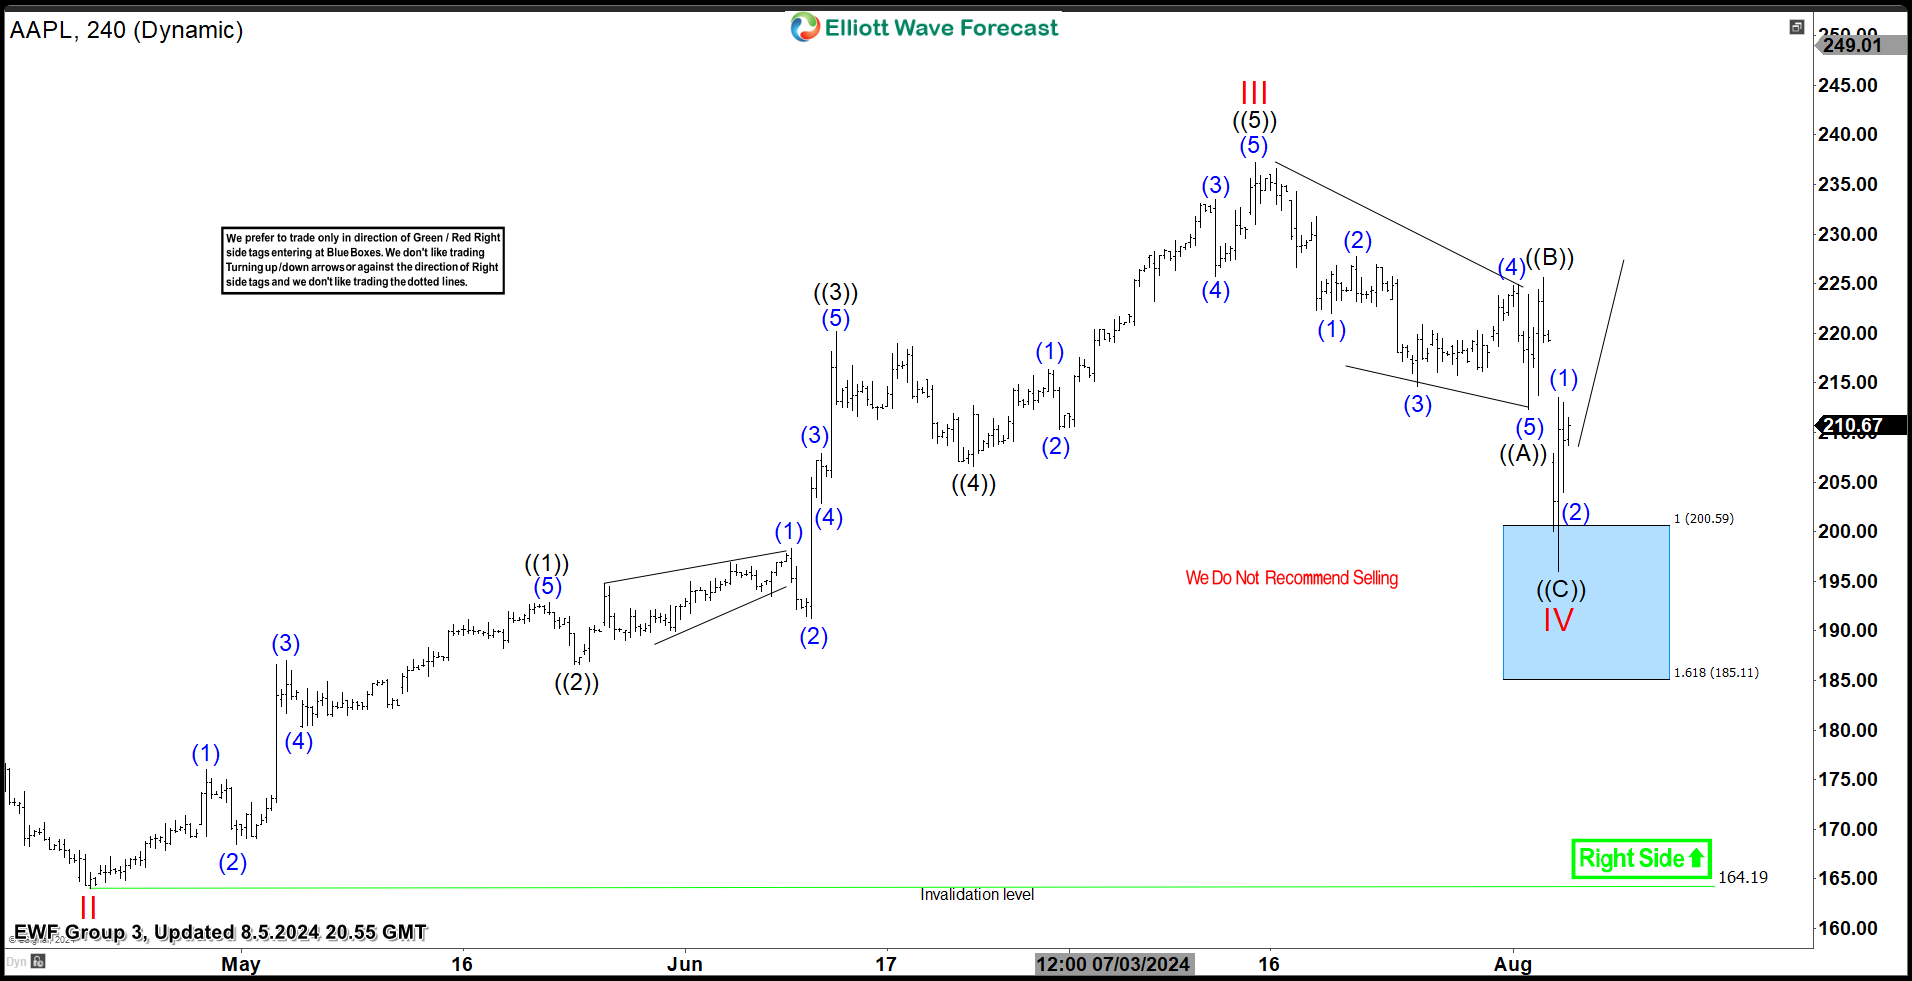
AAPL H4 Update 08.05.2024

The stock has given us correction against the 164.19 low. The pullback has already reached the
extreme zone (Blue Box) and giving us reaction from there. At this stage, we advise against selling the
stock and favor the long side from the marked H4 Blue Box area. AAPL could either see a rally to new
highs or a larger corrective bounce in at least three waves.

A quick reminder:

Our charts are designed for simplicity and ease of trading:
▪ Red bearish stamp + blue box = Selling Setup
▪ Green bullish stamp + blue box = Buying Setup
▪ Charts with Black stamps are deemed non-tradable.

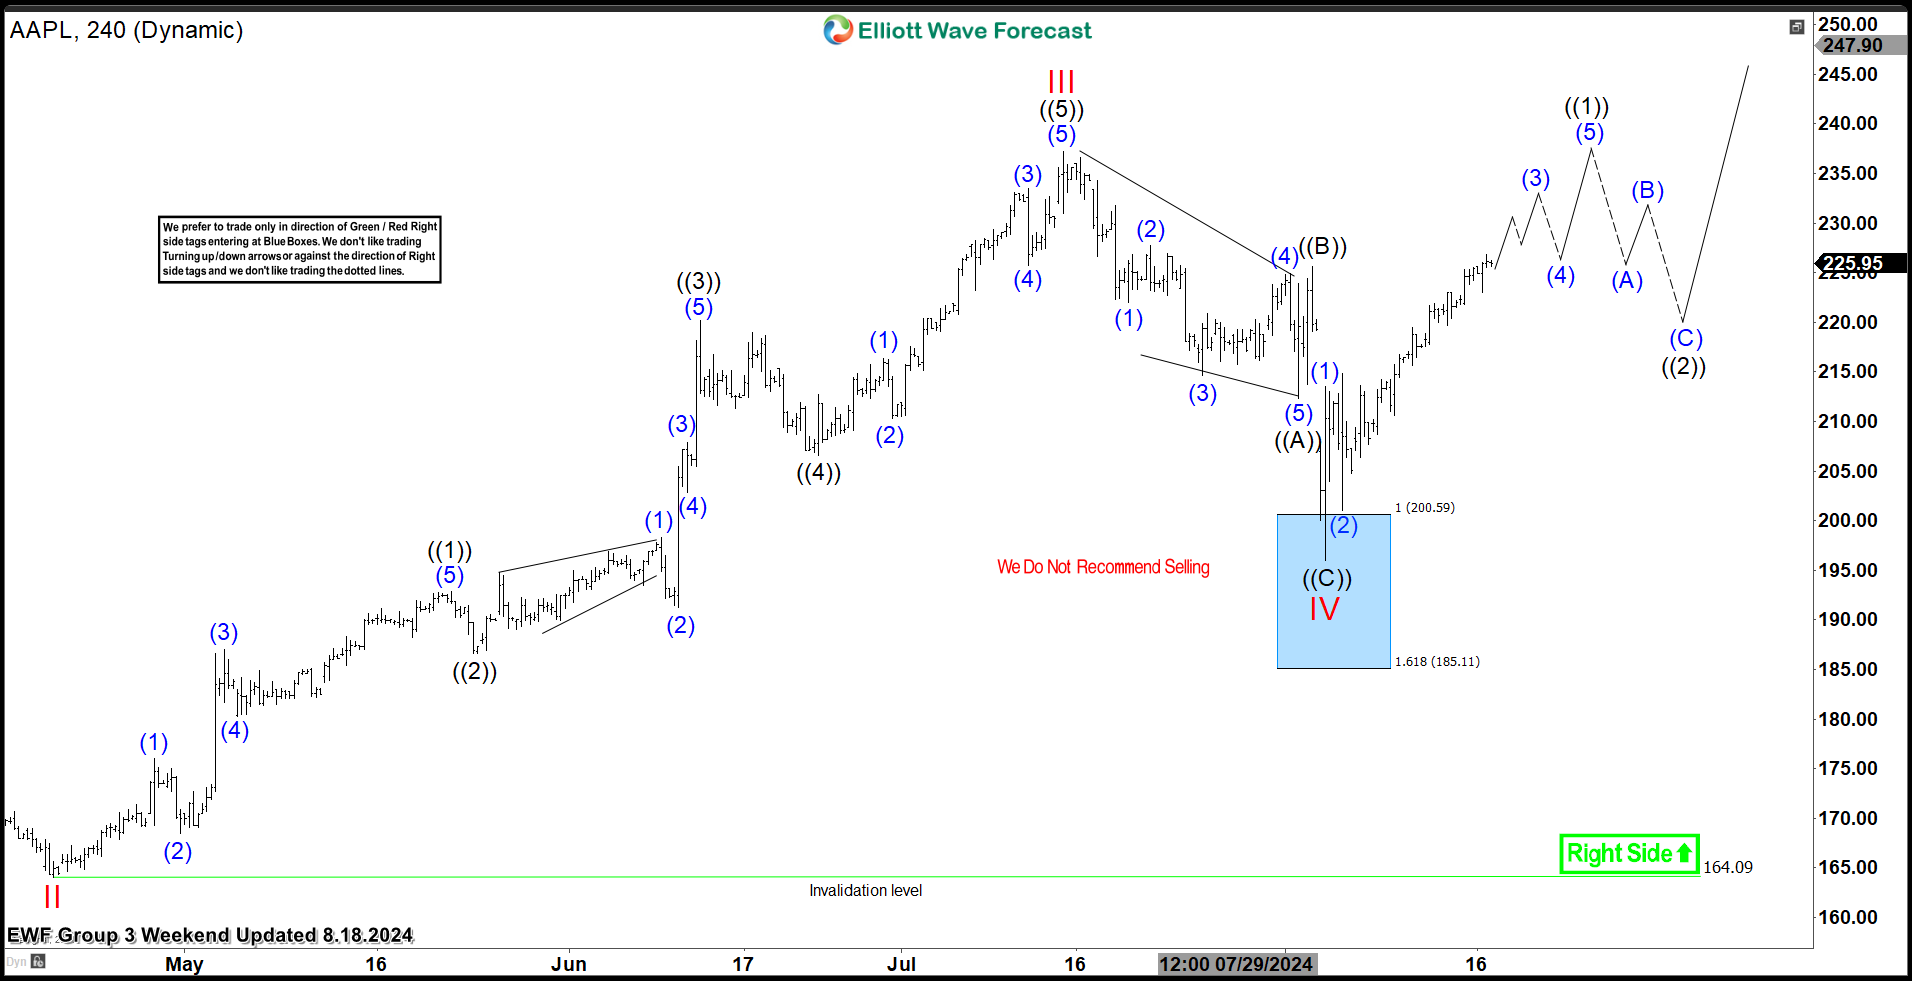
AAPL H4 Update 08.18.2024

The stock responded exactly as anticipated at the Blue Box Area, attracting buyers and initiating a substantial rally from our recommended buying zone. We would like to see break of III red peak to confirm next leg up is in progress.

To capitalize on these opportunities and stay ahead, consider exploring our expert services and insights. 

Author

Elliott Wave Forecast Team

Elliott Wave Forecast Team

ElliottWave-Forecast.com

More from Elliott Wave Forecast Team
Share:

Editor's Picks

EUR/USD looks weak below 1.1800

EUR/USD has slipped back under pressure, breaking through the 1.1800 support and drifting towards the weekly lows near 1.1770 ahead of the opening bell in Asia. The move reflects renewed strength in the US Dollar, with steady geopolitical tensions keeping its demand firm. Moving forward, the release of the German labour market report and flash inflation figures should keep European investors entertained on Friday.
 

GBP/USD threatens the 200-day SMA near 1.3440

GBP/USD rapidly leaves behind Wednesday’s strong advance, coming under heavy pressure and retesting the 1.3440 zone, where the critical 200-day SMA is located. Cable’s deep pullback follows the strong gains in the Greenback, while investors continue to pencil in a potential BoE rate cut in March.

Gold remains below $5,200 despite tariff jitters and geopolitical risks

Gold is seen consolidating in a range below the $5,200 mark during the Asian session on Friday amid mixed cues. Trade jitters, along with the risk of a potential US-Iran war, act as a tailwind for the safe-haven bullion. Meanwhile, the Fed's hawkish outlook keeps the US Dollar close to the monthly high and caps the non-yielding yellow metal. Nevertheless, the commodity remains on track to register gains for the fourth straight week, though the fundamental backdrop warrants some caution for bullish traders.

How AI, blockchain, stablecoins are shaping a new global economy – Circle CEO Jeremy Allaire

Artificial Intelligence (AI), blockchain technology and stablecoins are emerging as core pillars of a new global economic system, according to Circle’s CEO, Jeremy Allaire.

Changing the game: International implications of recent tariff developments

The Supreme Court ruling on International Emergency Economic Powers Act (IEEPA) tariffs provides limited relief for the rest of the world, with weighted average tariff rates modestly lower.

Bitcoin steadies as traders eye US–Iran talks

Bitcoin (BTC) price is stabilizing around $68,000 at the time of writing on Thursday after a 6.2% relief rally the previous day amid a broader downward trend.