Apple Inc (AAPL) Elliott Wave technical analysis [Video]
![Apple Inc (AAPL) Elliott Wave technical analysis [Video]](https://editorial.fxstreet.com/images/Markets/Equities/Industries/CommunicationServices/mobile-phone-637435389695511071_XtraLarge.jpg)
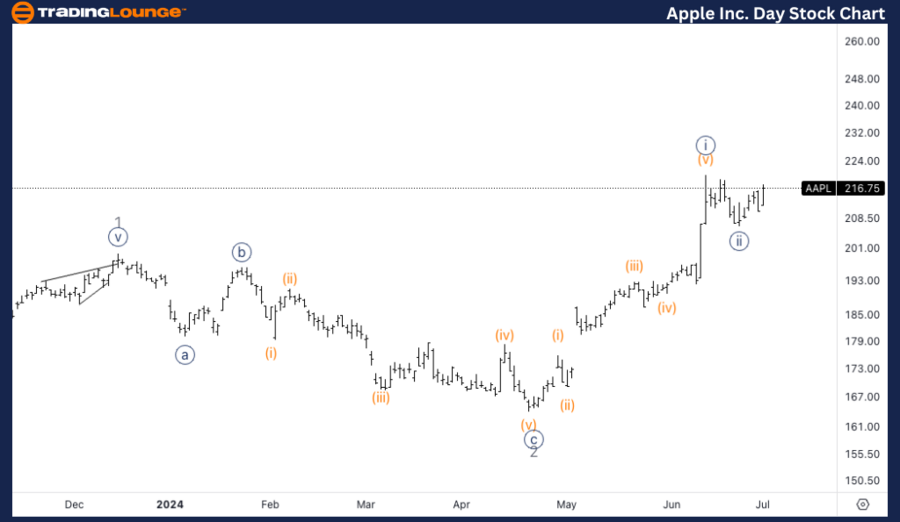
AAPL Elliott Wave Analysis Trading Lounge Daily Chart,
Apple Inc., (AAPL) Daily Chart.
AAPL Elliott Wave technical analysis
Function: Trend.
Mode: Impulsive.
Structure: Motive.
Position: Wave 3.
Direction: Upside in wave 3.
Details: Looking for a five-wave subdivision into wave 3 as we seem to have completed wave {i} of 3 after successfully breaking above TL2 at 200$.
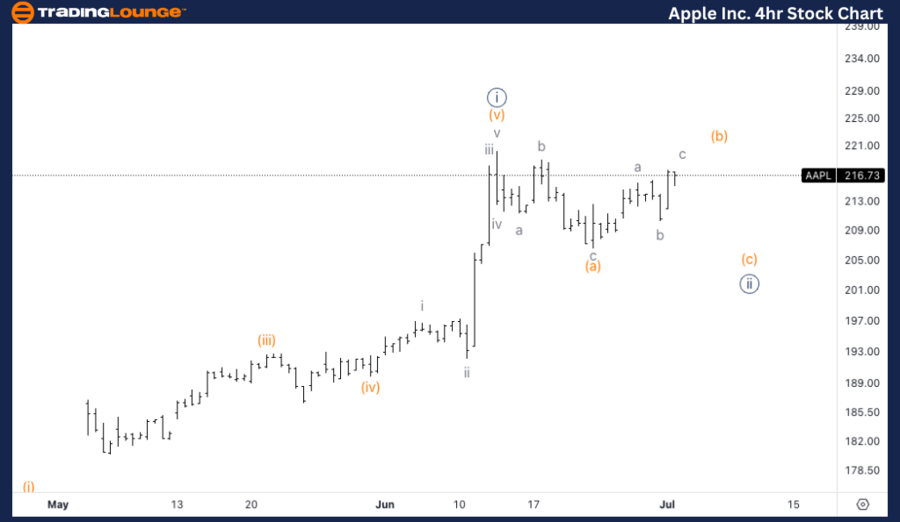
AAPL Elliott Wave Analysis Trading Lounge 4Hr Chart,
Apple Inc., (AAPL) 4Hr Chart.
AAPL Elliott Wave technical analysis
Function: Trend.
Mode: Impulsive.
Structure: Motive.
Position: Wave.
Direction: Bottom in wave {ii}.
Details: Here we are investigating into wave {ii}, as there is a possibility wave {ii} is yet to complete and we could see one more leg lower towards 200$.
This Elliott Wave analysis of Apple Inc. (AAPL), provides insights into the stock’s current market structure and potential price movements. The analysis examines both the daily and 4-hour charts to understand the trends and forecasts for AAPL's price action.
AAPL Elliott Wave technical analysis – Daily chart
AAPL is currently developing a five-wave subdivision within wave 3. The stock appears to have completed wave {i} of 3 after breaking above the significant trendline resistance at 200$. The confirmation of the break above this level supports the bullish outlook for wave 3. The subsequent subdivisions of wave 3 should include minor waves that continue to push higher.
AAPL Elliott Wave technical analysis – Four-hour chart
The current analysis indicates that wave {ii} is either nearing completion or has the potential for one more leg lower. This wave {ii} is a pullback phase that may target levels close to 200$, providing a corrective consolidation before the resumption of the uptrend in wave {iii} of 3. Traders should look for signs of a bottom in wave {ii} as an opportunity to enter positions for the anticipated continuation higher.
Technical analyst: Alessio Barretta.
AAPL Elliott Wave technical analysis [Video]
Author

Peter Mathers
TradingLounge
Peter Mathers started actively trading in 1982. He began his career at Hoei and Shoin, a Japanese futures trading company.


