Apple Stock Price and Forecast: Why AAPL stock is going to fall
- Apple stock remains in a sideways range with little movement.
- AAPL stock needs to break out of the range.
- The iPhone maker looks bearish but is consolidating near highs.

Apple stock continues to be fairly quiet and rangebound despite some reassuring inflation data from the US on Wednesday. That inflation data was still pretty high but not as bad as economists had been fearing. The market briefly rallied before the summer lull set in. Apple, being the S&P 500 leader, should have pulled along, but instead everything seemed to return to the grind higher as the session wore on. Apple had a tiny 119-tick range from high to low and the S&P 500 (SPY) was also flatlining. Apple stock eventually slumbered to the close at $145.86 for a small gain of 0.18%. Most stocks were quiet with only the meme names once again providing some volatility and even that was way down on their peak.
Apple has now put down several days of low volatility with small daily ranges. Generally, this is a sign of something waiting to happen, a coiled spring. Eventually, something will occur to uncoil the spring and cause a breakout.
-637643607664227862.png)
Apple key statistics
| Market Cap | $2.4 trillion |
| Enterprise Value | $2.3 trillion |
| Price/Earnings (P/E) | 29 |
|
Price/Book | 38 |
| Price/Sales | 9 |
| Gross Margin | 41% |
| Net Margin | 25% |
| EBITDA | $112 billion |
| 52 week low | $89.14 |
| 52 week high | $150 |
| Average Wall Street rating and price target |
Buy $165 |
Apple released results at the end of July, and they once again were comfortably ahead of expectations. Back in late April Apple beat estimates by 40%. This time in late July, earnings per share (EPS) beat by 30% and revenue was also well ahead of forecasts. However, the stock has yet to see solid follow-through. Apple stock pushed to a record high on the announcement but was soon trading lower and has remained in the mid $140s since. This may be a consolidation phase before a new phase of the bullish trend or it may be a more worrying double top formation at $150 with two tops from July 15 and 27.
Apple stock forecast
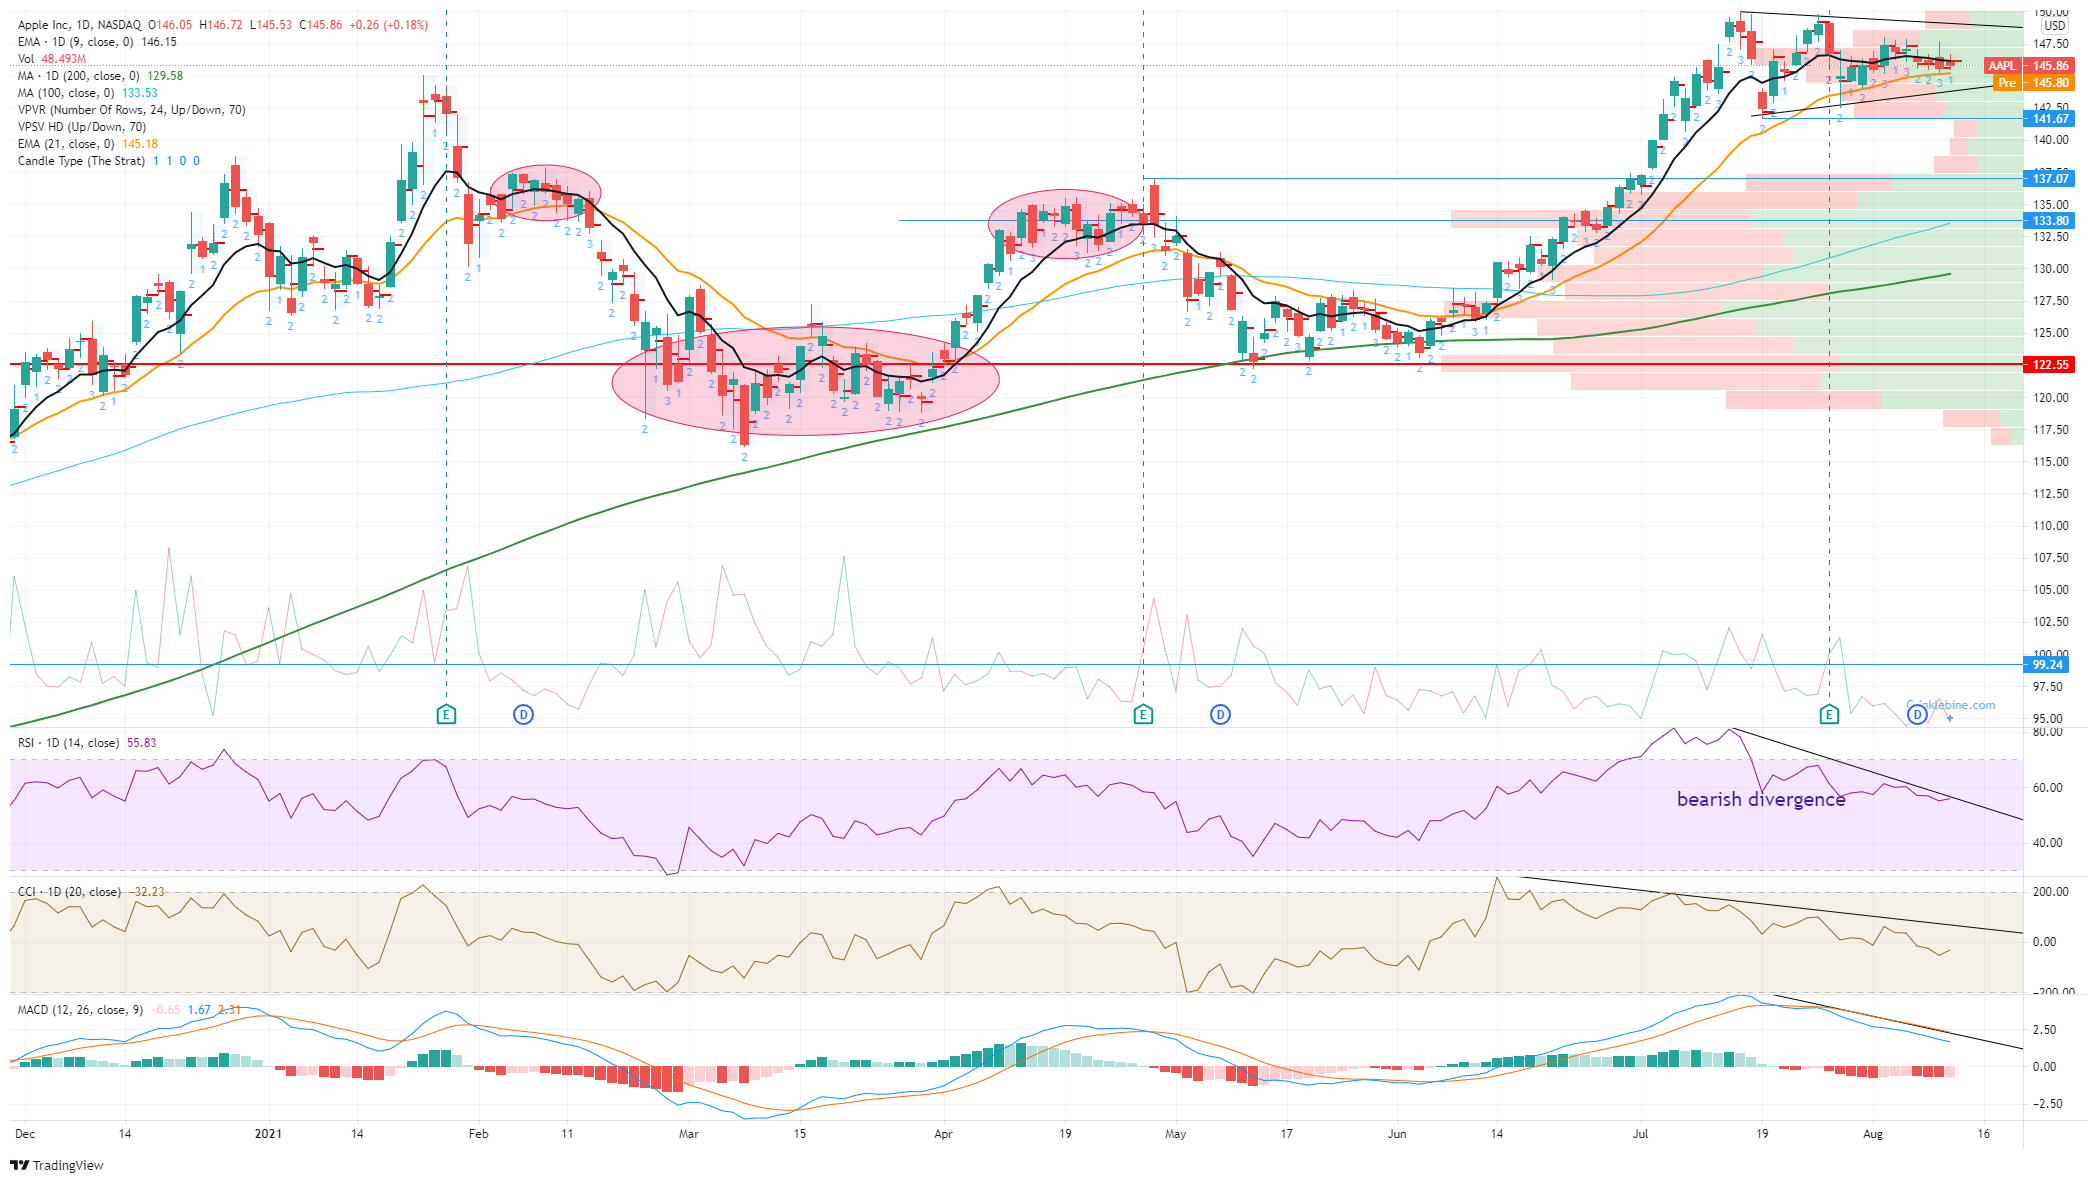
The monthly chart is giving us an indecision candle. No surprise, but the failure to break July's $150 top begins to look increasingly bearish. This double top is clearer in the daily chart. A double top formation is not confirmed until the stock breaks below the first retracement from the initial top. In the case of Apple, this is at $141.67, the horizontal line shown for clarity.
The Relative Strength Index (RSI), Commodity Channel Index (CCI) and Moving Average Convergence Divergence (MACD) are all trending lower from the first peak at $150 and did not match the second peak or double top. Apple was also cautious on the post-earnings conference call about outlook and guidance.
We are sticking with our bearish call based on the bearish earnings call, bearish divergences and declining volatility. This can be well played using options as volatility will increase on a breakout in either direction. Usually though markets fall more dramatically than they rise. A $135 put for August 27 costs about $0.30 cents per share. If Apple breaks $141.67 it should move pretty quickly toward $133.80. If you are bullish and see a breakout to new highs then a $155 call for August 27 costs $0.19 cents per share.
Like this article? Help us with some feedback by answering this survey:
Premium
You have reached your limit of 3 free articles for this month.
Start your subscription and get access to all our original articles.
Author

Ivan Brian
FXStreet
Ivan Brian started his career with AIB Bank in corporate finance and then worked for seven years at Baxter. He started as a macro analyst before becoming Head of Research and then CFO.


