- Apple again barely moves on Tuesday as it flatlines.
- AAPL stock is poised near all-time highs.
- Apple stock awaiting CPI later on Wednesday.
Apple stock again barely registered a move on Tuesday as the overall market continues to trade very cautiously ahead of Wednesday's US CPI data. Inflation has been off the agenda for a while now as the Fed hammered home the message that it was "transitory" and the market eventually took the message. This set the stage for equities to stage a neat summer rally with the underperforming Nasdaq taking on the leadership role and pushing to new highs. The other indices just followed suit. Apple stock was not to be outdone, rousing itself from the low $120s to push on through to record highs and in the process nearly crack $150.
-637642689790958188.png)
Apple released results at the end of July, and they once again were comfortably ahead of expectations. Back in late April Apple beat estimates by 40%. This time in late July, earnings per share (EPS) beat by 30% and revenue was also well ahead of forecasts. However, the stock has yet to see solid follow-through. Apple stock pushed to a record high on the announcement but was soon trading lower and has remained in the mid $140s since. This may be a consolidation phase before a new phase of the bullish trend or it may be a more worrying double top formation at $150, with two tops from July 15 and 27.
Apple key statistics
| Market Cap | $2.4 trillion |
| Enterprise Value | $2.3 trillion |
| Price/Earnings (P/E) | 29 |
|
Price/Book |
38 |
| Price/Sales | 9 |
| Gross Margin | 41% |
| Net Margin | 25% |
| EBITDA | $112 billion |
| 52 week low | $89.14 |
| 52 week high | $150 |
| Average Wall Street rating and price target |
Buy $165 |
Apple stock forecast
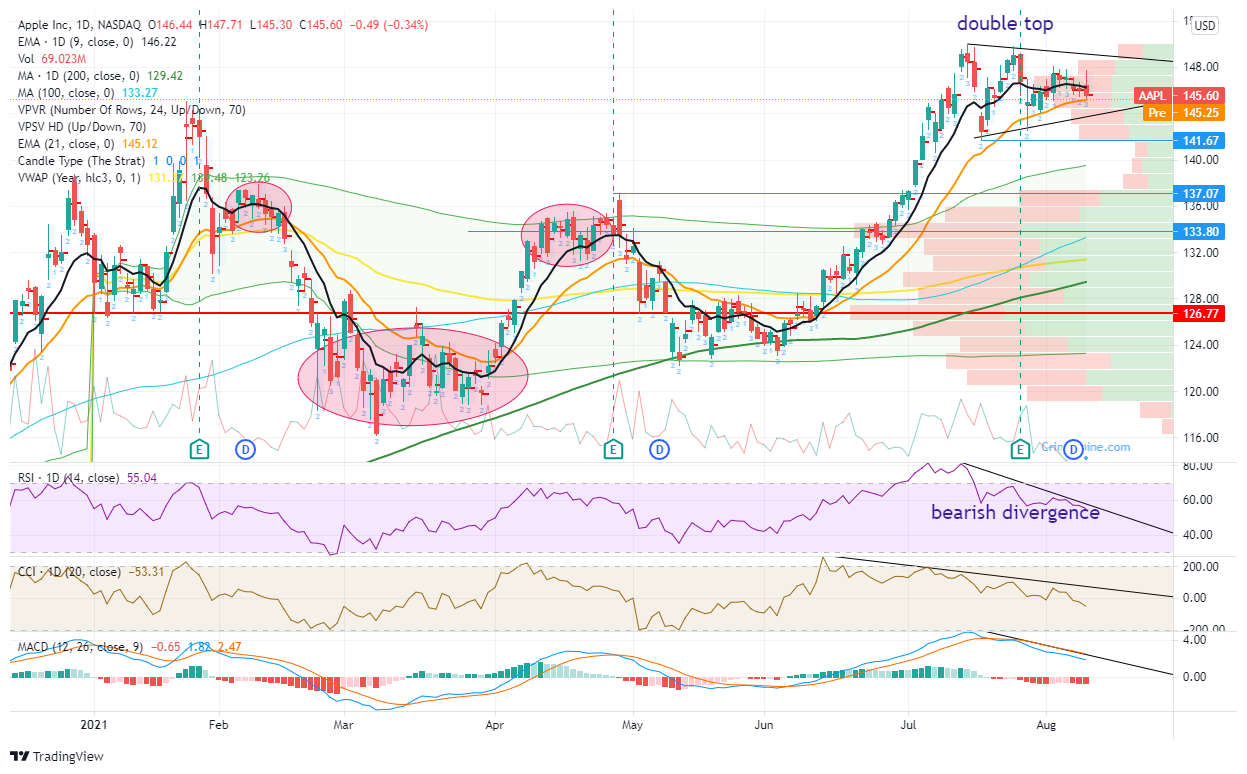
The chart below identifies clearly the double top formation in place with two peaks at $150. A double top is a bearish formation but in this case, it has yet to trigger. A double top formation is not confirmed until the stock breaks below the first retracement from the initial top. In the case of Apple, this is at $141.67. We have drawn a horizontal line to make this more clear on the chart. Breaking $141.67 confirms the double top and is then a strong bearish signal. Adding to the bearish technical overview are the bearish divergences seen from the main momentum oscillators. The Relative Strength Index (RSI), Commodity Channel Index (CCI), and Moving Average Convergence Divergence (MACD) are all trending lower from the first peak at $150 and did not match the second peak or double top. Apple was also cautious on the post earnings conference call about outlook and guidance.
Our strategy then is to wait for a confirmation of the double top. A break of $141.67 should accelerate due to the lack of volume as we can see from the volume profile bars on the right of the chart. Support does not pick up again until the low $130's. $133.80 should be the short term target of a break of $141.67. Buying a put option should see benefits from the directional move and from the expected increase in volatility a=due to the lack of volume under $141.47.
Failure to break the $141.67 level should see Apple stock look to break the small wedge formation in place before testing again all time highs at $150. But this move is more likely to be slow and steady without much acceleration.
Like this article? Help us with some feedback by answering this survey:
Information on these pages contains forward-looking statements that involve risks and uncertainties. Markets and instruments profiled on this page are for informational purposes only and should not in any way come across as a recommendation to buy or sell in these assets. You should do your own thorough research before making any investment decisions. FXStreet does not in any way guarantee that this information is free from mistakes, errors, or material misstatements. It also does not guarantee that this information is of a timely nature. Investing in Open Markets involves a great deal of risk, including the loss of all or a portion of your investment, as well as emotional distress. All risks, losses and costs associated with investing, including total loss of principal, are your responsibility. The views and opinions expressed in this article are those of the authors and do not necessarily reflect the official policy or position of FXStreet nor its advertisers. The author will not be held responsible for information that is found at the end of links posted on this page.
If not otherwise explicitly mentioned in the body of the article, at the time of writing, the author has no position in any stock mentioned in this article and no business relationship with any company mentioned. The author has not received compensation for writing this article, other than from FXStreet.
FXStreet and the author do not provide personalized recommendations. The author makes no representations as to the accuracy, completeness, or suitability of this information. FXStreet and the author will not be liable for any errors, omissions or any losses, injuries or damages arising from this information and its display or use. Errors and omissions excepted.
The author and FXStreet are not registered investment advisors and nothing in this article is intended to be investment advice.
Recommended content
Editors’ Picks

EUR/USD remains near 1.0400 post-US PCE
The US Dollar’s inconclusive price action allows some recovery in EUR/USD, keeping the pair around the 1.0400 region following the release of PCE inflation data for the month of January.

Gold slumps to fresh multi-week lows below $2,840
Gold stays under bearish pressure and trades at its lowest level in three weeks below $2,840. The uncertainty surrounding the Trump administration's trade policy and month-end flows seem to be weighing on XAU/USD, which remains on track to snap an eight-week winning streak.

GBP/USD clings to gains just above 1.2600 after PCE data
GBP/USD remains positively oriented in the 1.2600 neighbourhood as the Greenback is navigating a vacillating range following the PCE inflation release.

The week ahead – US Payrolls, ECB rate meeting, ITV results – W/c 3rd March
Having seen the Federal Reserve keep rates on hold last month the US labour market continues to show remarkable resilience, despite seeing a slowdown in hiring in January, after a blow out December number.

Weekly focus – Tariff fears are back on the agenda
While the timing of the EU measures remains still uncertain, Trump surprised markets on Thursday by signalling that the 25% tariffs on Canada and Mexico will be enacted when the one-month delay runs out next Tuesday.

The Best brokers to trade EUR/USD
SPONSORED Discover the top brokers for trading EUR/USD in 2025. Our list features brokers with competitive spreads, fast execution, and powerful platforms. Whether you're a beginner or an expert, find the right partner to navigate the dynamic Forex market.