AAPL Stock Price and Forecast: With Apple stuck, is it time to buy?
- Apple recovers but stalls at the 9-day moving average.
- AAPL stock is now in a high volume resistance area.
- IPhone maker still trying to break back above $152.
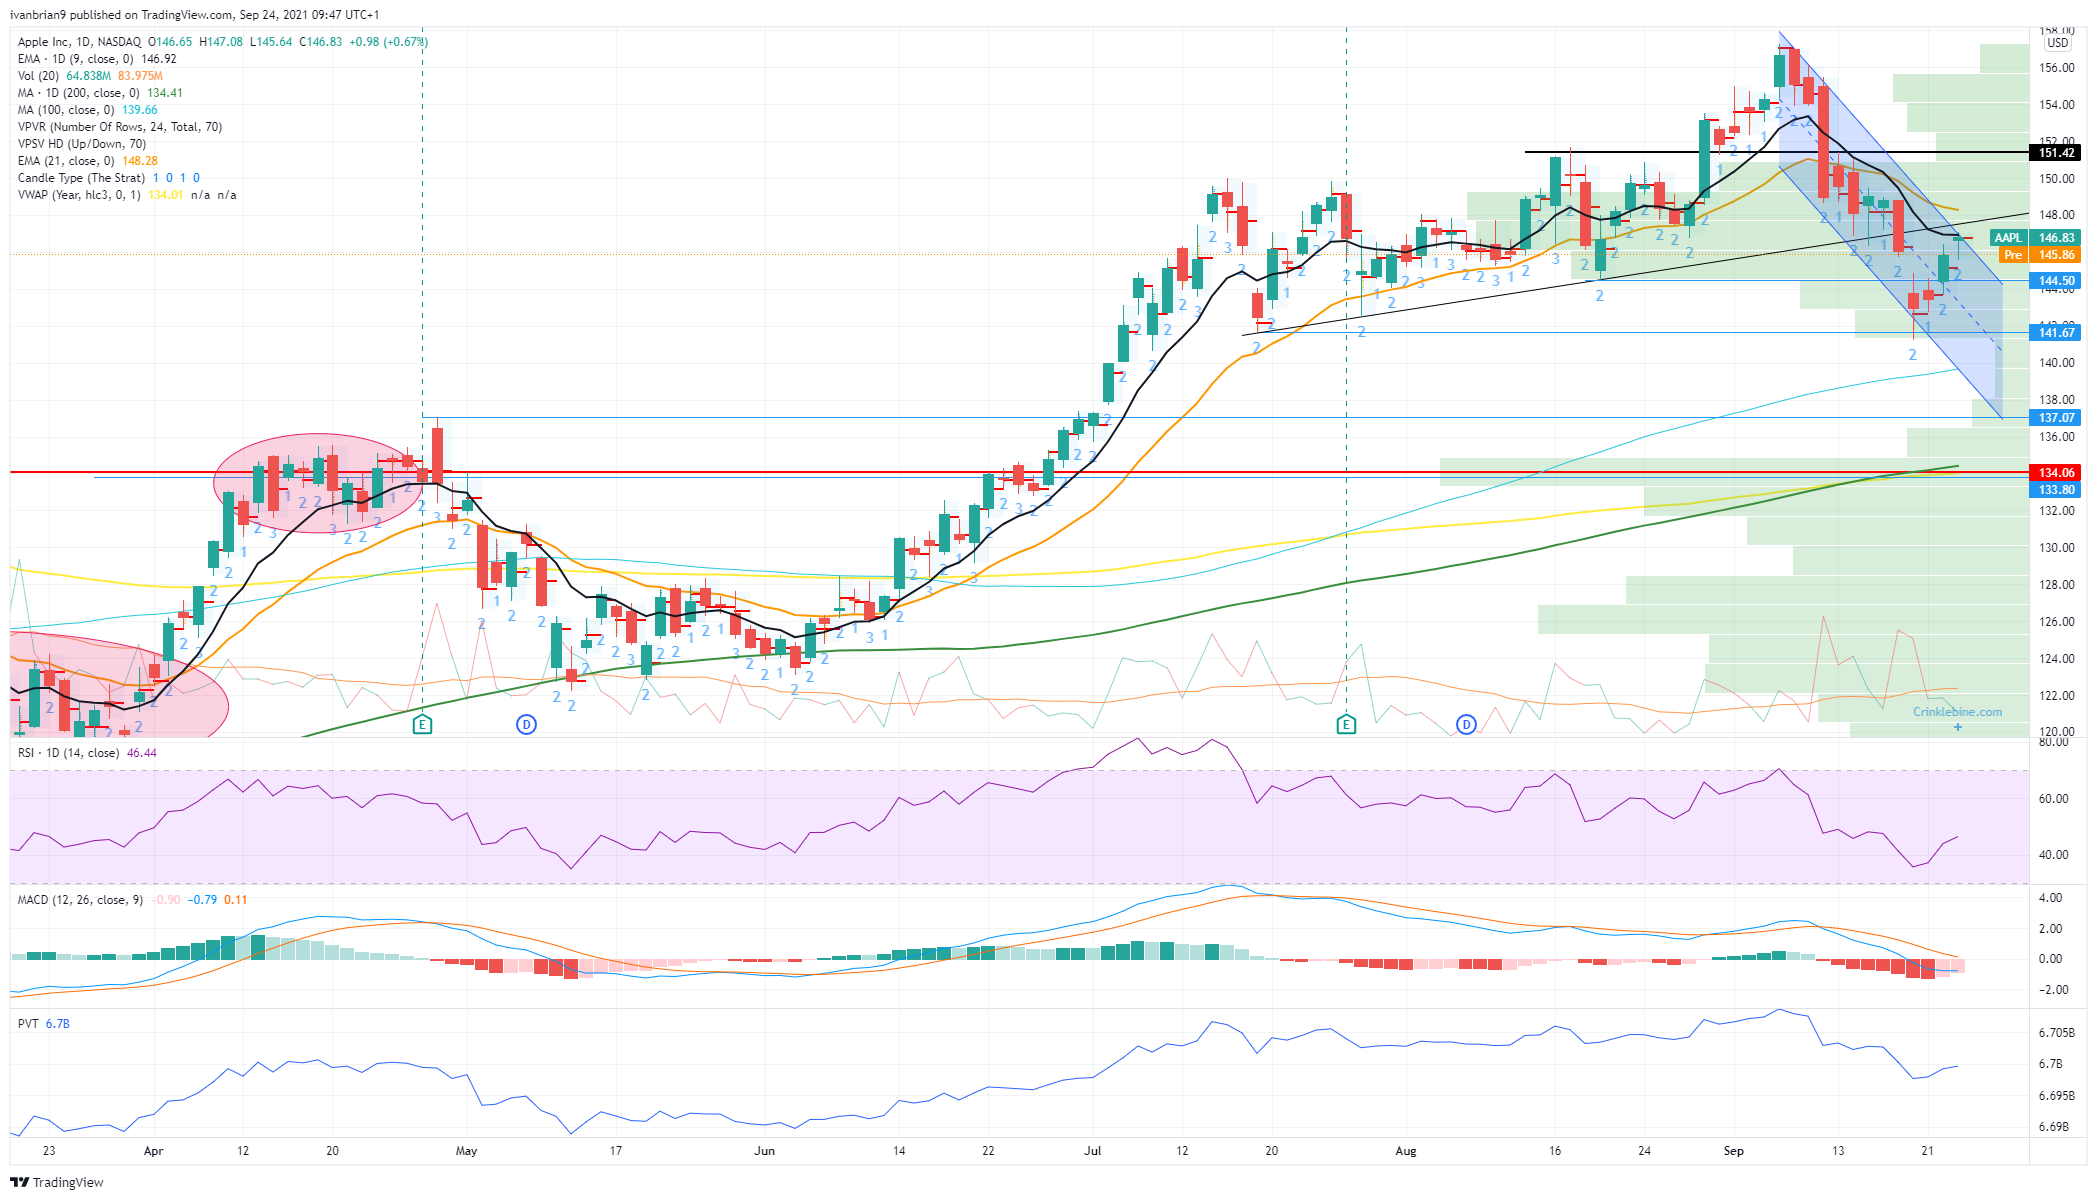
Apple recovered further ground on Thursday, but the move ran out of steam at the key short-term, 9-day moving average. This or the 8 or 10-day moving average (whichever is your preference) are closely watched by short-term swing traders as it gives an easy guide to sentiment. In strong moves it can guide prices higher or lower as seen from Apple between June and July. Buying dips to the 9-day moving average would have kept you on that strong surge from $125 to $150.
-637680684235352022.png)
Apple 15-minute chart
The move on Wednesday had closed toward the high of the daily range, which is usually taken as a positive. Thursday duly saw a continuation with a gap open that Apple filled before rallying back up and stabilizing around $146. Apple stock closed at $146.83 for a gain of 0.67%. We do mention this a lot, but it is amazing how many times markets look to fill a gap.
Apple key statistics
| Market Cap | $2.4 trillion |
| Enterprise Value | $2.3 trillion |
| Price/Earnings (P/E) | 29 |
|
Price/Book | 38 |
| Price/Sales | 9 |
| Gross Margin | 41% |
| Net Margin | 25% |
| EBITDA | $112 billion |
| 52 week low | $103.10 |
| 52 week high | $157.26 |
| Average Wall Street rating and price target |
Buy $166.7 |
Apple stock forecast
Now that Apple has arrested the decline and retraced to the 9-day moving average, the next stage of the recovery needs to begin. This is why we remain neutral on the stock for now. Apple is in an area of high volume, making gains harder to achieve. Only above $152 do we turn bullish as this takes out last week's high of $151.42 and will make the weekly candle an outside candle, assuming we do this next week and not this week. Technically, the short-term chart turned bearish on September 10 with a sharp fall below the 9 and 21-day moving averages, which set a lower high, always a classic bearish trend. This was not followed up with a lower low until $144.50 was broken on Monday. This created the channel highlighted. Apple is now at the point of breaking out of this, but only breaking last week's high at $151.42 will turn us bullish.
FXStreet View: Neutral, bearish below $144.50, bullish above $152.
Premium
You have reached your limit of 3 free articles for this month.
Start your subscription and get access to all our original articles.
Author

Ivan Brian
FXStreet
Ivan Brian started his career with AIB Bank in corporate finance and then worked for seven years at Baxter. He started as a macro analyst before becoming Head of Research and then CFO.


