Apple Stock Forecast: AAPL returns to test 200-day moving average support, stages textbook bounce
- AAPL shares have retreated as retail and meme stocks take the headlines.
- Apple heads back to a strong support zone around the 200-day moving average
- Stock struggling for momentum post stellar results.
Update: so far so textbook as Apple shares retrace early in the session to test and successfully bounce from the 200-day moving average. Futures marekts have turned from the premarket enthusiasm and Apple trades just around flat on the day at the time of writing.
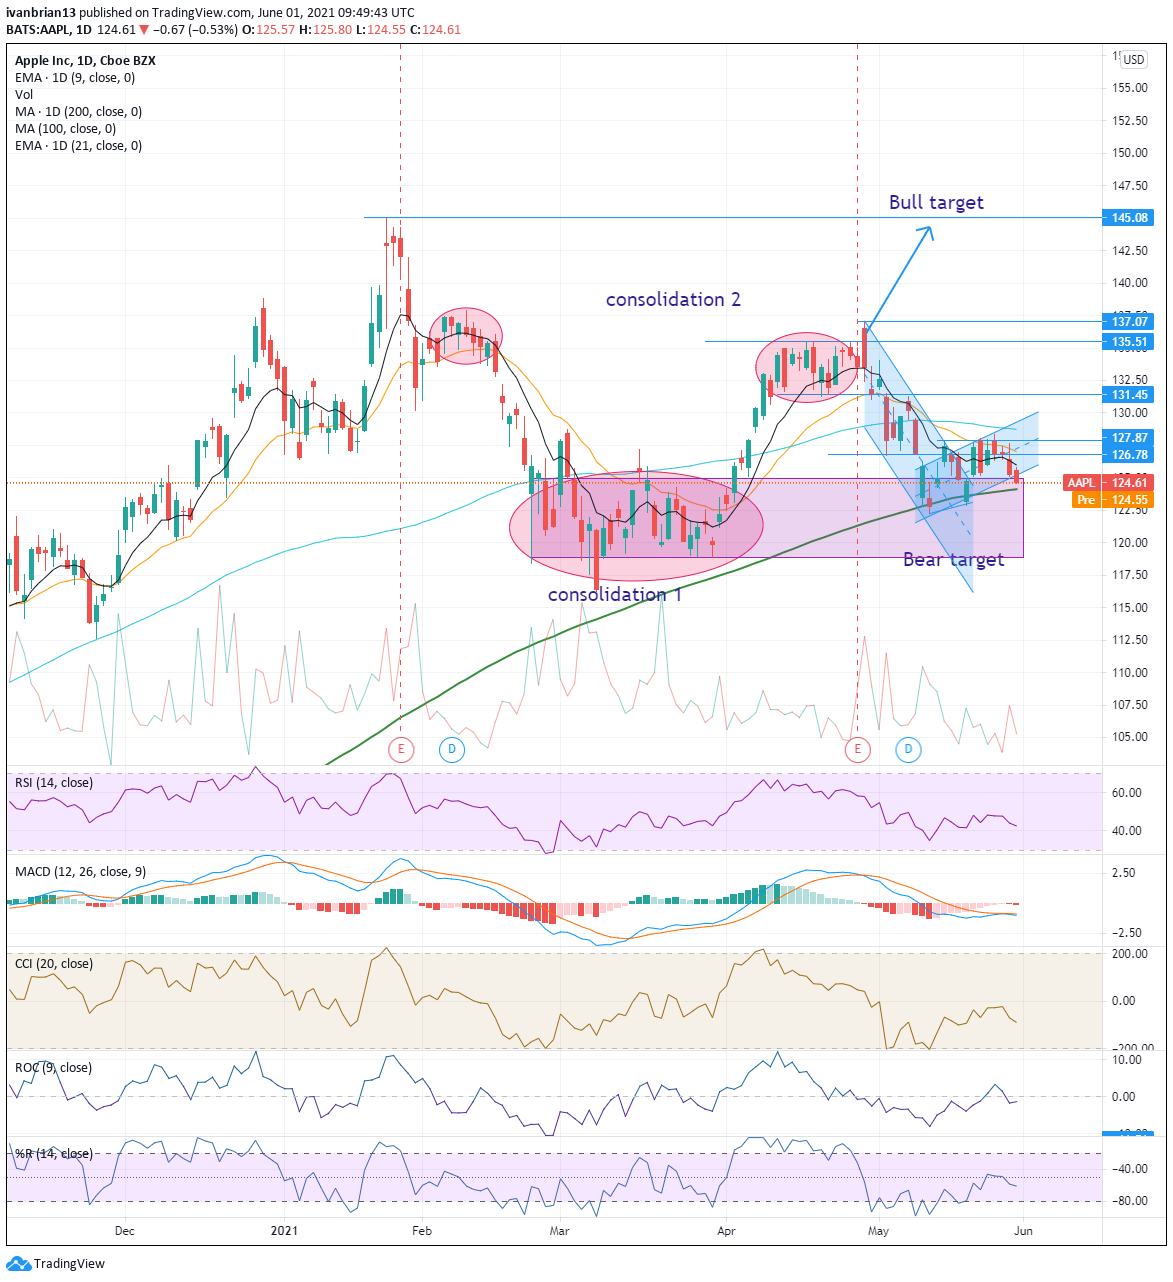
AAPL shares have really not been right since reporting strong earnings on April 28 despite the stock making renewed efforts at a rally. However, this move stalled late last week as AMC and other meme names returned to grab traders attention, leaving Apple to slip quietly back toward $125. The sideways, directionless trend looks to continue. Those results back in late April really were knock-out level, but the stock failed to react accordingly. Earnings per share were reported at $1.40 versus the average analyst forecast of $0.99, a 40% beat. AAPL shares were trading at $131 at the time of earnings and popped up to $137 before gradually sliding back to $122. This was a strong support zone as evidenced in the chart with a large period of consolidation back in March and April. The 200-day moving average also played its part in halting the AAPL slide. Apple shares have made a new series of lower lows and higher highs, signifying a new uptrend. Friday's price action was a little disappointing as AAPL slipped out of the nascent uptrend and put it into question. As we have demonstrated previously, levels sub-$125 represent a strong support region.
AAPL stock forecast
The directionless or range trade seems to be the way of things presently with any gains being short-lived and Apple once again retracing to its support region. There is nothing really tasty to get trading teeth into until Apple has a good look at the 200-day moving average. Currently, this sits at $124.12, not too far away from current price levels and provides an opportunity to initiate a long position. Risk management is always up to a trader's own discretion, but a break just below the 200-day moving average would need to be watched closely as it would signal a technically long-term bearish move assuming it was sustained. Careful risk management as always is the advice.
This 200-day moving average is also a strong region of consolidation from back in March and April, meaning any attempt to break lower will likely take time if it succeeds at all. The momentum oscillators are all in neutral territory, while the Moving Average Convergence Divergence (MACD) indicator is looking to make a bearish crossover. The 200-day moving average will give a nice test of just how weak the current sentiment is. Breaking below the 9 and 21-day moving average shows the short-term trend has turned bearish, but the 200-day level is a more significant barometer for longer-term views and should see longer-term players enter the market and buy the stock. If not, Apple will look to $116.21. AAPL has not traded below its 200-day moving average since March 2020.
| Support | 124.12 200-day | 122.25 | 116.21 | ||
| Resistance | 127.87 pivot short term | 131.45 | 135.51 | 137.07 |
At the time of writing, the author has no position in any stock mentioned in this article and no business relationship with any company mentioned. The author has not received compensation for writing this article, other than from FXStreet.
This article is for information purposes only. The author and FXStreet are not registered investment advisors and nothing in this article is intended to be investment advice. It is important to perform your own research before making any investment and take independent advice from a registered investment advisor.
FXStreet and the author do not provide personalized recommendations. The author makes no representations as to accuracy, completeness, or the suitability of this information. FXStreet and the author will not be liable for any errors, omissions or any losses, injuries or damages arising from this information and its display or use. The author will not be held responsible for information that is found at the end of links posted on this page.
Errors and omissions excepted.
Premium
You have reached your limit of 3 free articles for this month.
Start your subscription and get access to all our original articles.
Author

Ivan Brian
FXStreet
Ivan Brian started his career with AIB Bank in corporate finance and then worked for seven years at Baxter. He started as a macro analyst before becoming Head of Research and then CFO.


