Apple (AAPL) Stock Forecast: Stay tuned for Apple watch as $137 set to break
- Apple shares rally just short of $137.07 resistance on Wednesday.
- AAPL should break through aggressively as volume is light above $137.
- Record highs the only resistance once AAPL stock breaks through.
Update after the close: Apple shares closed just below our key $137 resistance as the tech giant looks to match other big tech companies in printing new highs. A relatively calm day for markets saw the Nasdaq close lower while the Dow and S&P 500 went record-breaking again. Apple (AAPL) stock was the only big tech name in the green on Wednesday as it looks to play catch up from a disappointing May. $137 should lead to at least a look at record highs. It better get a move on though as the Nasdaq remains overbought on the Relative Strength Index (RSI).
Update: Apple watch is on for Wednesday as the stock ticks ever clsoer to breaking the $137.07 level. What worked for Tesla above $635 should work fro Apple due to the volume shelf thinning out dramatically once above $137. A lack of volume equates to a lack of resistance so watch this space. From there it would be rude not to test new highs.
Apple stock continues to make up lost ground to some other of its big tech peers as the stock continues its impressive recent form. The move had its origins in the retreat to the low $120s, which took place throughout May, just after Q1 results. We have dwelled on this before, but just to recap, those results were pretty spectacular and not the reason for the decline. Apple posted Q1 results over 40% higher than what Wall Street analysts had been expecting and added to the package by announcing it was increasing its dividend and share buy-back program. Despite this, AAPL stock moved steadily lower after results, apart from one intraday spike to $137.07, the level we have been mentioning as our resistance target.
May was not a good time for tech names and the Nasdaq, with investors focused on inflation and increasing yields. When a stock or financial instrument reacts counter to the news flow, it is a strong signal. Witness Tesla's positive reaction to the virtual recall (see more). Apple's negative reaction to the positive results eventually saw it slide over 10% before bottoming out in the low $120s. This area saw a convergence of strong support factors, the 200-day moving average and some strong volume from a previous consolidation zone. Once support had been found and the slide arrested, it was time to regroup. Apple has done that impressively.
The move has continued well this week, but the market has been in a good mood with Microsoft (MSFT) joining Apple in the $2-trillion-dollar club recently and Facebook spiking and hitting over a $1 trillion market cap.
-637606398272090368.png)
Apple key statistics
| Market Cap | $2.28 trillion |
| Enterprise Value | $2.1 trillion |
| Price/Earnings (P/E) | 30 |
|
Price/Book | 35 |
| Price/Sales | 8.5 |
| Gross Margin | 40% |
| Net Margin | 23.4% |
| EBITDA | $100 billion |
| Average Wall Street rating and price target | Buy $159 |
Apple stock forecast
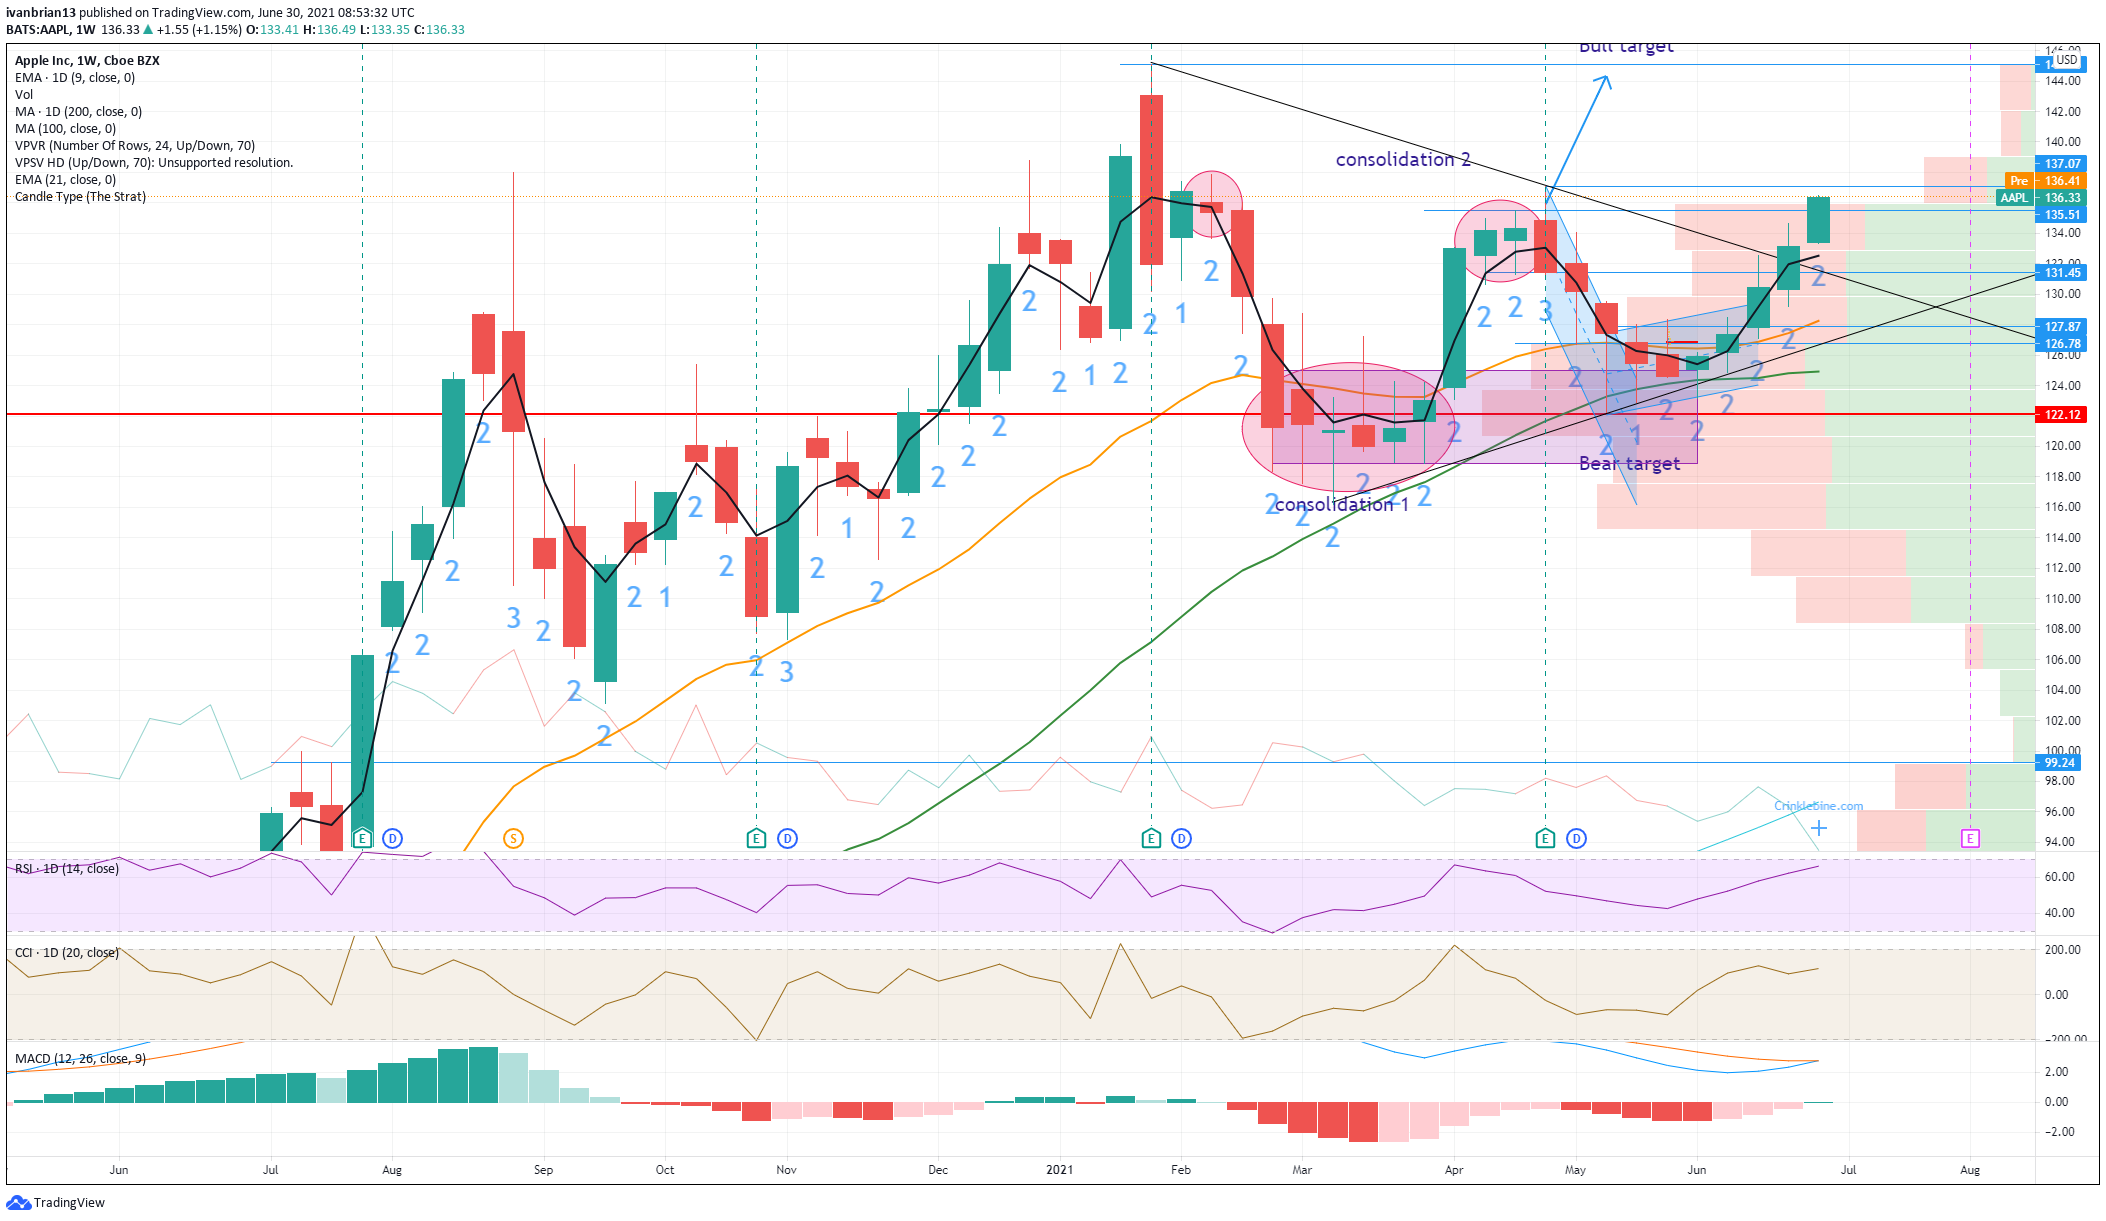
The weekly chart shows the strong continuation trend in place with a series of continuation candles. This is a form of analysis used by many traders to identify continuation and reversal trends. Each candle setting a higher high and higher low is a continuation, with trend following candle. It helps traders identify the trend easily and trade on the right side of it. These weekly candles show a strong trend in place. Clearly above $137, volume drops off significantly. The volume profile bars on the right of the chart show the amount of volume at each price point and the amount of buy and sell volume (red and green).
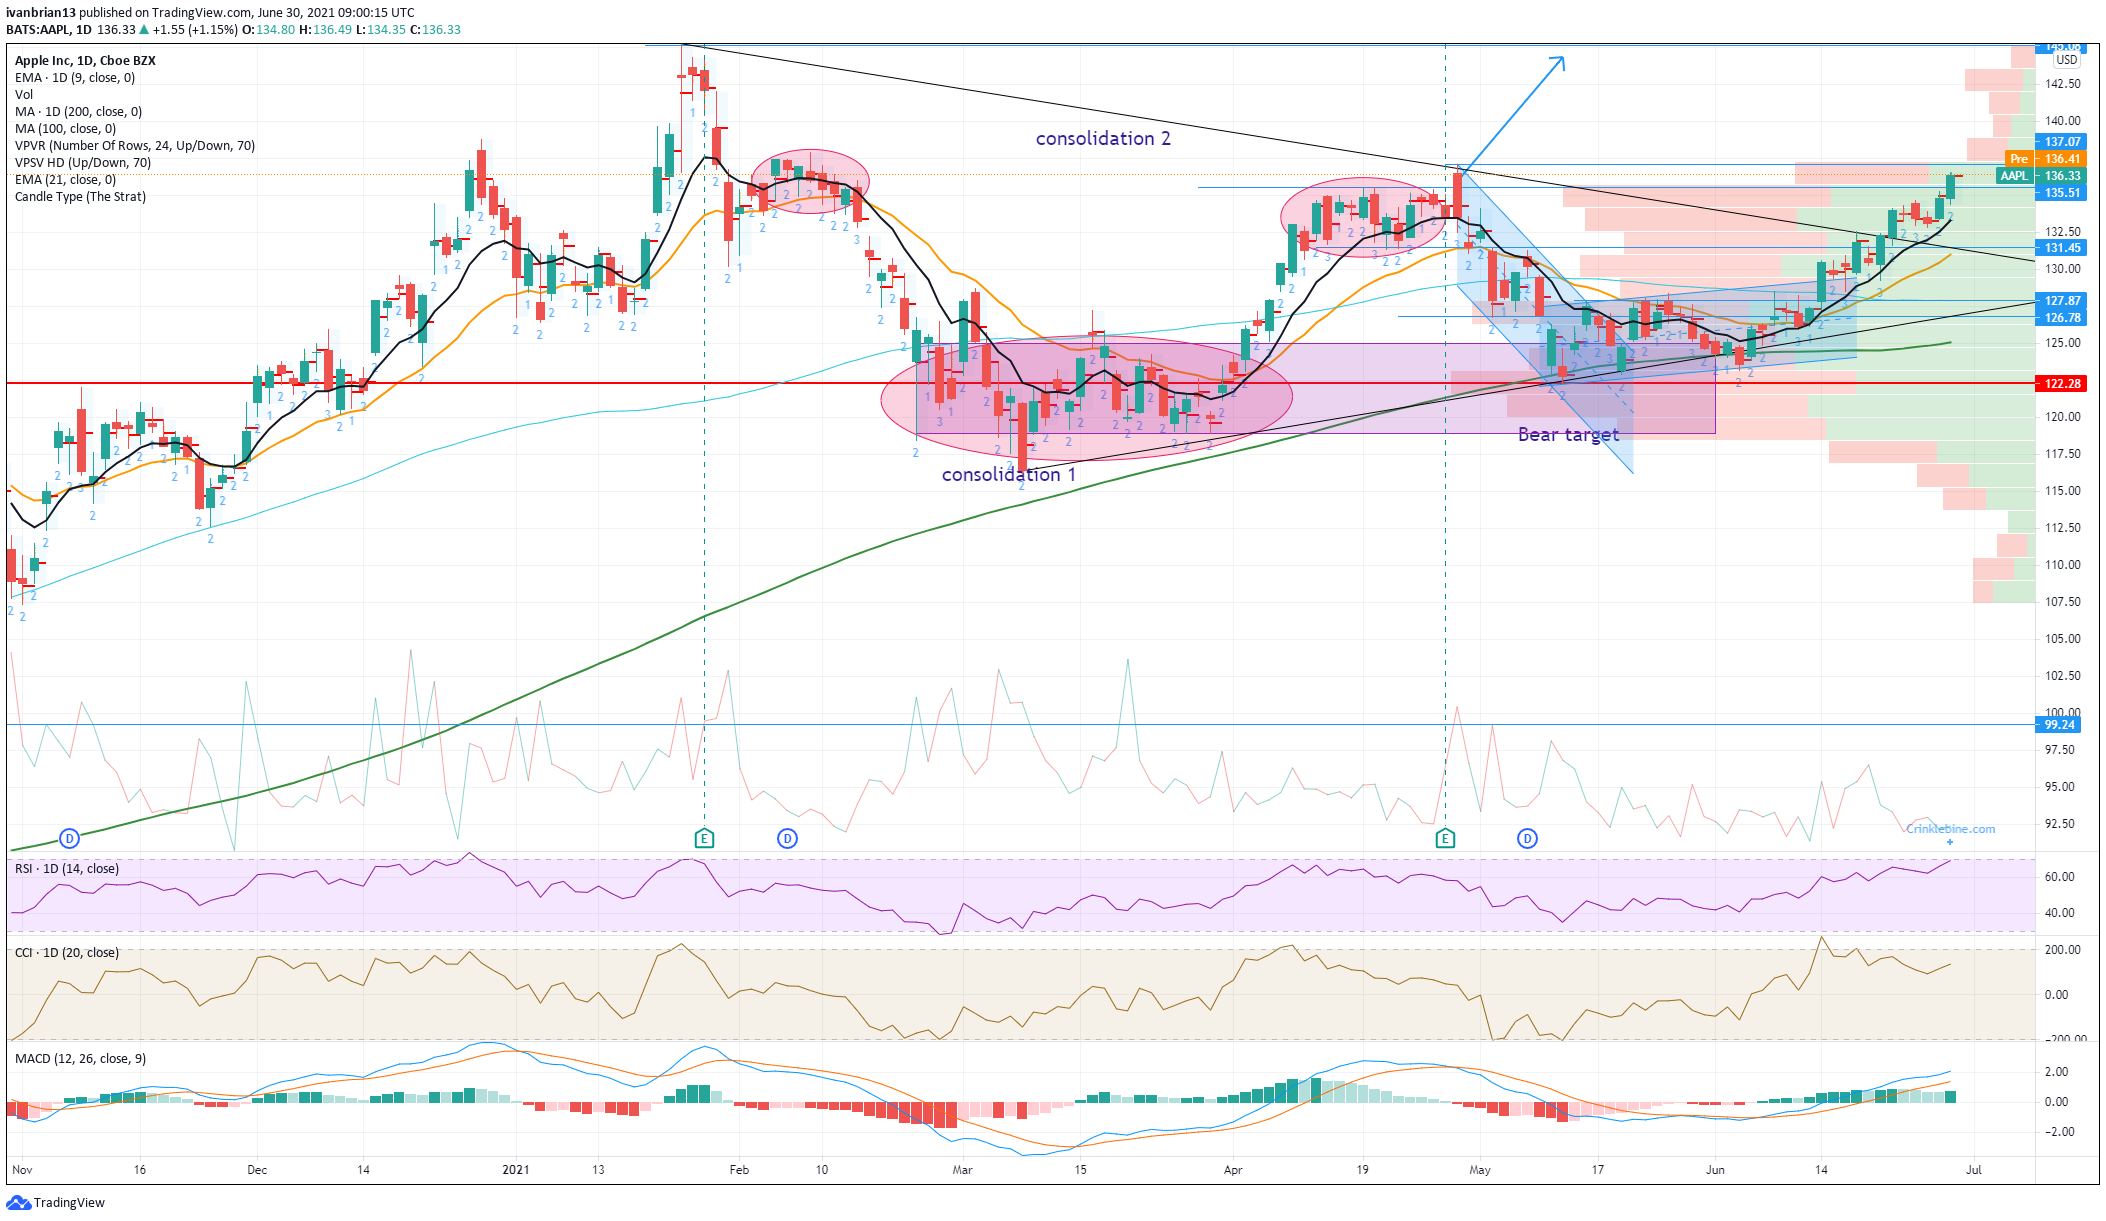
The daily chart shows the 9-day moving average as our guide for this ascent. This can be used as a good buy-the-dip strategy. What is also very noticeable and important is Monday and Tuesday's point of control. This is the price at which the highest volume took place in that day. On both days the point of control was near the top of the candle, a bullish sign. AAPL stock can retrace to $131.45 and still hold the bullish trend in place. This is the previous resistance and also now corresponds to the top of the triangle.
The risk reward, therefore, is clearly skewed to further gains with a strong trend in place and a potential acceleration above $137 due to the lack of volume. This may be played by using a call option strategy. Other smart players may be anticipating this as the $140 call for July 9 has the largest open interest. This call option costs about $0.40 (per share, each option contract is 100 shares), and an increase in price and volatility should see a nice return.
Like this article? Help us with some feedback by answering this survey:
Premium
You have reached your limit of 3 free articles for this month.
Start your subscription and get access to all our original articles.
Author

Ivan Brian
FXStreet
Ivan Brian started his career with AIB Bank in corporate finance and then worked for seven years at Baxter. He started as a macro analyst before becoming Head of Research and then CFO.


