Analog Devices Inc.(ADI) Elliott Wave technical analysis [Video]
![Analog Devices Inc.(ADI) Elliott Wave technical analysis [Video]](https://editorial.fxstreet.com/images/TechnicalAnalysis/ChartPatterns/PointFigure/hand-pointing-graph-elements-of-this-image-furnished-by-nasa-76654497_XtraLarge.jpg)
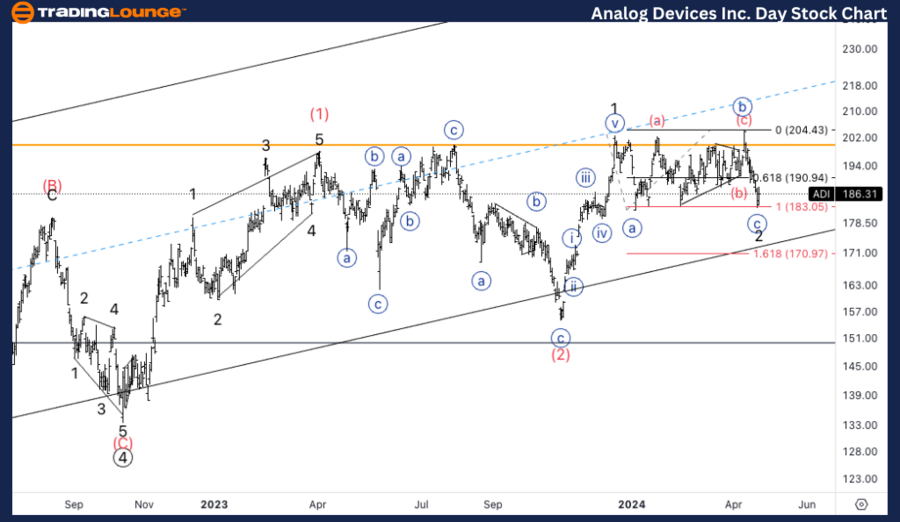
ADI Elliott Wave technical analysis
Function: Counter Trend.
Mode: Corrective.
Structure: Flat.
Position: Minor wave 2 of (3).
Direction: Bottom in wave 2.
Details: Looking for support to be found within the end of MG2 at 180, we will start looking for long afte we finally find support on top of TL2 at 200$.
ADI Elliott Wave technical analysis – Daily chart
Our study reveals that Analog Devices is currently in a counter trend phase with a corrective flat structure, specifically positioned in Minor wave 2 of a larger Intermediate wave (3). The key focus is on identifying the bottom of wave 2. The analysis predicts finding support near the MG2 zone around $180. A bullish outlook is anticipated post-establishing a strong support level, especially above the TL2 at $200.
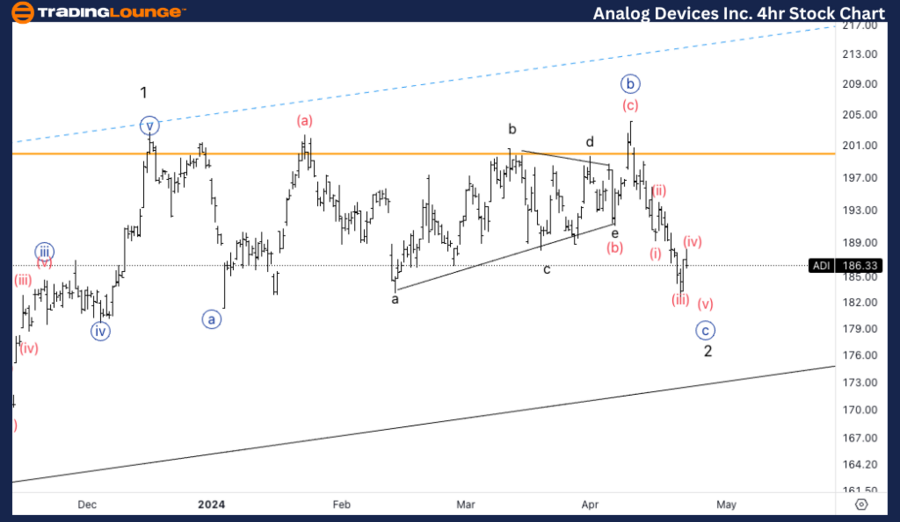
ADI Elliott Wave Technical Analysis
Function: Counter Trend
Mode: Corrective
Structure: Flat
Position: Wave {c} of 2.
Direction: Bottom in wave 2.
Details: As we saw on the Daily, we touched equality of {c} vs. {a}. we can expect another leg lower to ideally take wave {a} low out, to then start turning higher.
ADI Elliott Wave technical analysis – Four-hour chart
The 4-hour chart analysis complements the daily insights by delving deeper into the specifics of wave {c} of Minor wave 2. Consistent with the daily observations, wave {c} has reached a point of equality with wave {a}, signaling a potential completion of the corrective pattern. A final leg lower is expected, ideally surpassing the low of wave {a}, setting the stage for a bullish reversal.
ADI Elliott Wave technical analysis [Video]
Author

Peter Mathers
TradingLounge
Peter Mathers started actively trading in 1982. He began his career at Hoei and Shoin, a Japanese futures trading company.


