|

AMZN keep reacting higher from the blue box areas

In this technical blog, we will look at the past performance of the 1-hour Elliott Wave Charts of Amazon ticker symbol: AMZN. In which, the rally from 01 May 2023 low unfolded as an impulse structure. And showed a higher high sequence favored more upside extension to take place. Therefore, we advised members not to sell the stock & buy the dips in 3, 7, or 11 swings at the blue box areas. We will explain the structure & forecast below:

AMZN 1-hour Elliott Wave chart from 7.10.2023

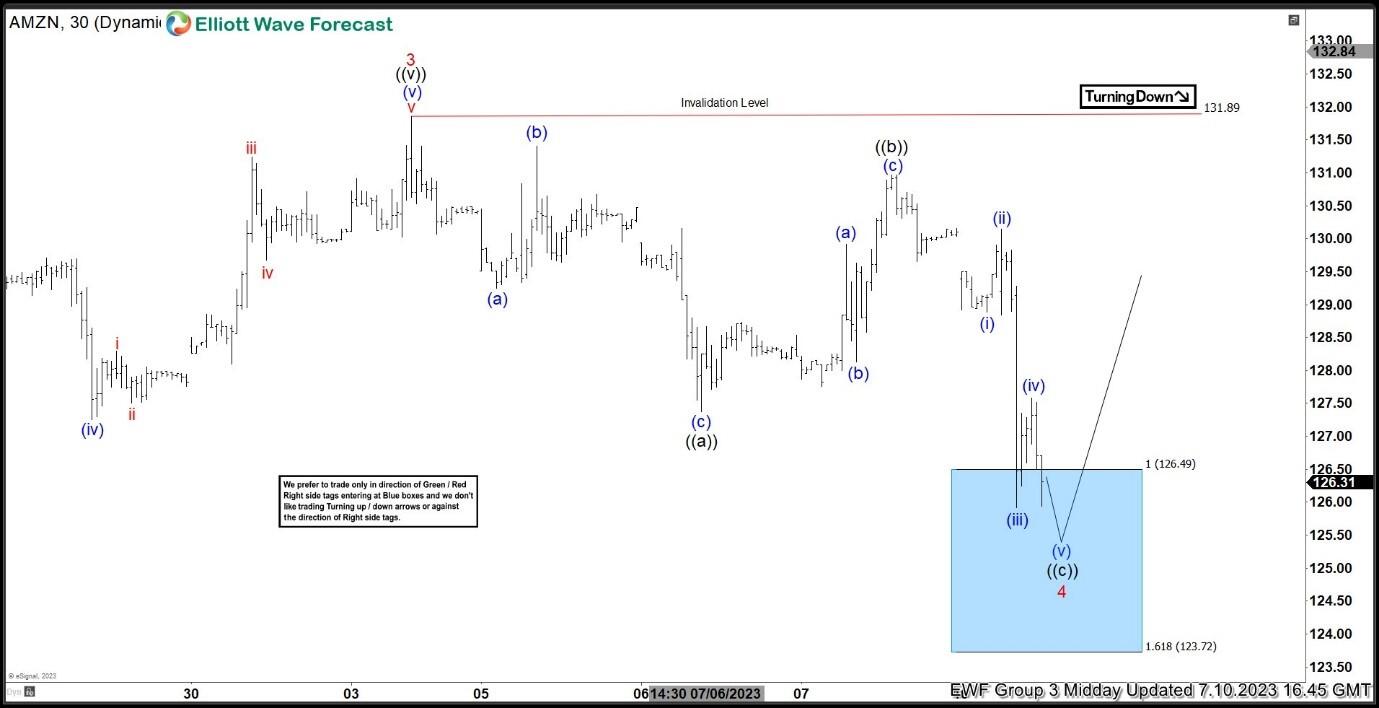
Here’s the 1hr Elliott wave chart from the 7/10/2023 Midday update. In which, the rally from the 5/01/2023 low unfolded in an impulse sequence where wave 3 ended at $131.85 high. Down from there, the stock made a pullback in wave 4 while the internals of that pullback unfolded as Elliott wave flat structure where wave ((a)) ended at $127.37 low. Wave ((b)) ended at $130.97 high and wave ((c)) managed to reach the blue box area at $126.49- $123.72 area. From there, buyers were expected to appear looking for the next leg higher or for a 3 wave bounce minimum.

AMZN latest 1-hour Elliott Wave chart from 7.14.2023

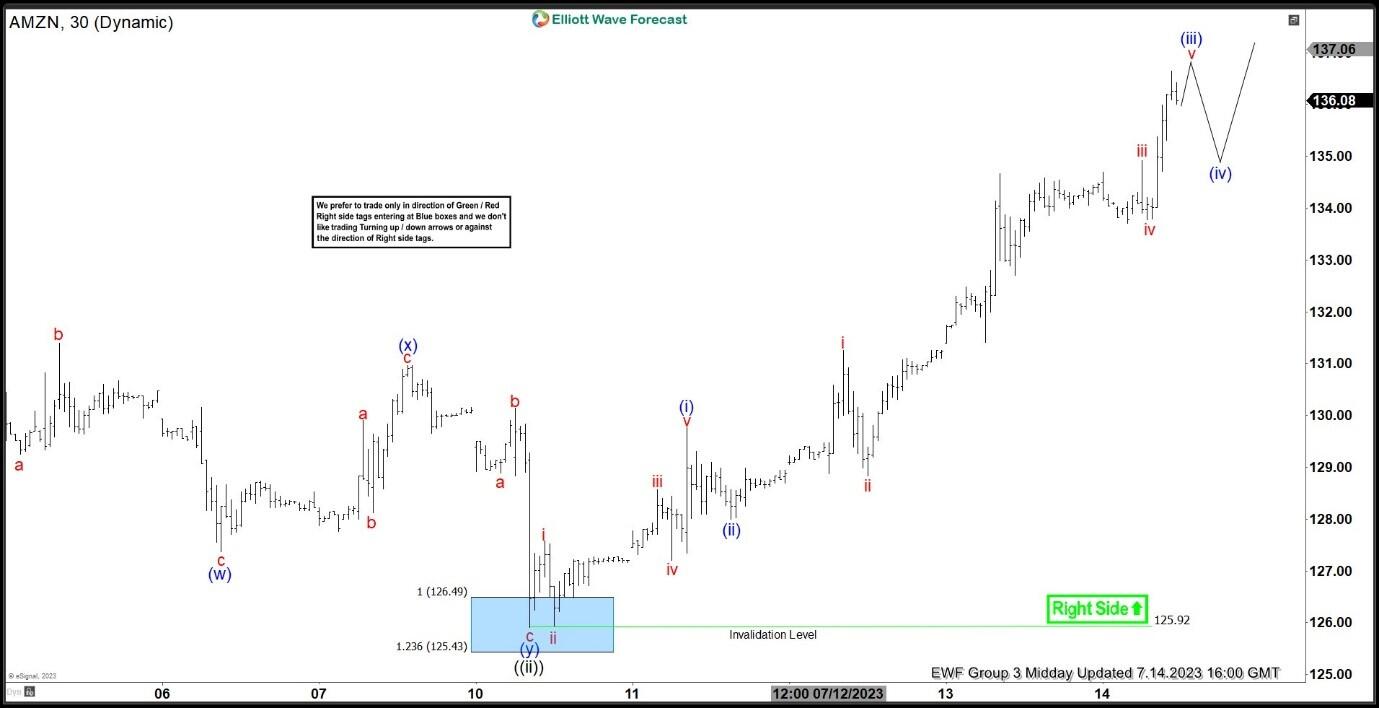
This is the latest 1hr Elliott wave Chart from the 7/14/2023 Midday update. In which the stock is showing a reaction higher taking place, right after ending the pullback within the blue box area. Allowed members to create a risk-free position shortly after taking the long position at the blue box area. Since then the stock has already made a new high confirming the next extension higher & erased divergence opening up further upside towards $137.39- $144.49 area next before a pullback happens. It’s important to note that with further data, the pullback adjusted to a double three correction.

Author

Elliott Wave Forecast Team

Elliott Wave Forecast Team

ElliottWave-Forecast.com

More from Elliott Wave Forecast Team
Share:

Editor's Picks

EUR/USD stays defensive below 1.1900 as USD recovers

EUR/USD trades in negative territory for the third consecutive day, below 1.1900 in the European session on Thursday. A modest rebound in the US Dollar is weighing on the pair, despite an upbeat market mood. Traders keep an eye on the US weekly Initial Jobless Claims data for further trading impetus. 

GBP/USD holds above 1.3600 after UK data dump

\GBP/USD moves little while holding above 1.3600 in the European session on Thursday, following the release of the UK Q4 preliminary GDP, which showed a 0.1% growth against a 0.2% increase expected. The UK industrial sector activity deteriorated in Decembert, keeping the downward pressure intact on the Pound Sterling. 

Gold sticks to modest intraday losses as reduced March Fed rate cut bets underpin USD

Gold languishes near the lower end of its daily range heading into the European session on Thursday. The precious metal, however, lacks follow-through selling amid mixed cues and currently trades above the $5,050 level, well within striking distance of a nearly two-week low touched the previous day.

Cardano eyes short-term rebound as derivatives sentiment improves

Cardano (ADA) is trading at $0.257 at the time of writing on Thursday, after slipping more than 4% so far this week. Derivatives sentiment improves as ADA’s funding rates turn positive alongside rising long bets among traders.

A tale of two labour markets: Headline strength masks underlying weakness

Undoubtedly, yesterday’s delayed US January jobs report delivered a strong headline – one that surpassed most estimates. However, optimism quickly faded amid sobering benchmark revisions.

Sonic Labs’ vertical integration fuels recovery in S token

Sonic, previously Fantom (FTM), is extending its recovery trade at $0.048 at the time of writing, after rebounding by over 12% the previous day. The recovery thesis’ strengths lie in the optimism surrounding Sonic Labs’ Wednesday announcement to shift to a vertically integrated model, aimed at boosting S token utility.