|

American Express (AXP) hit target extending in wave ((5))

American Express Company (Amex), symbol AXP, is an American multinational financial services corporation that specializes in payment cards. Headquartered in New York City, it is one of the most valuable companies in the world and one of the 30 components of the Dow Jones Industrial Average.

AXP weekly chart April 2024

AXP

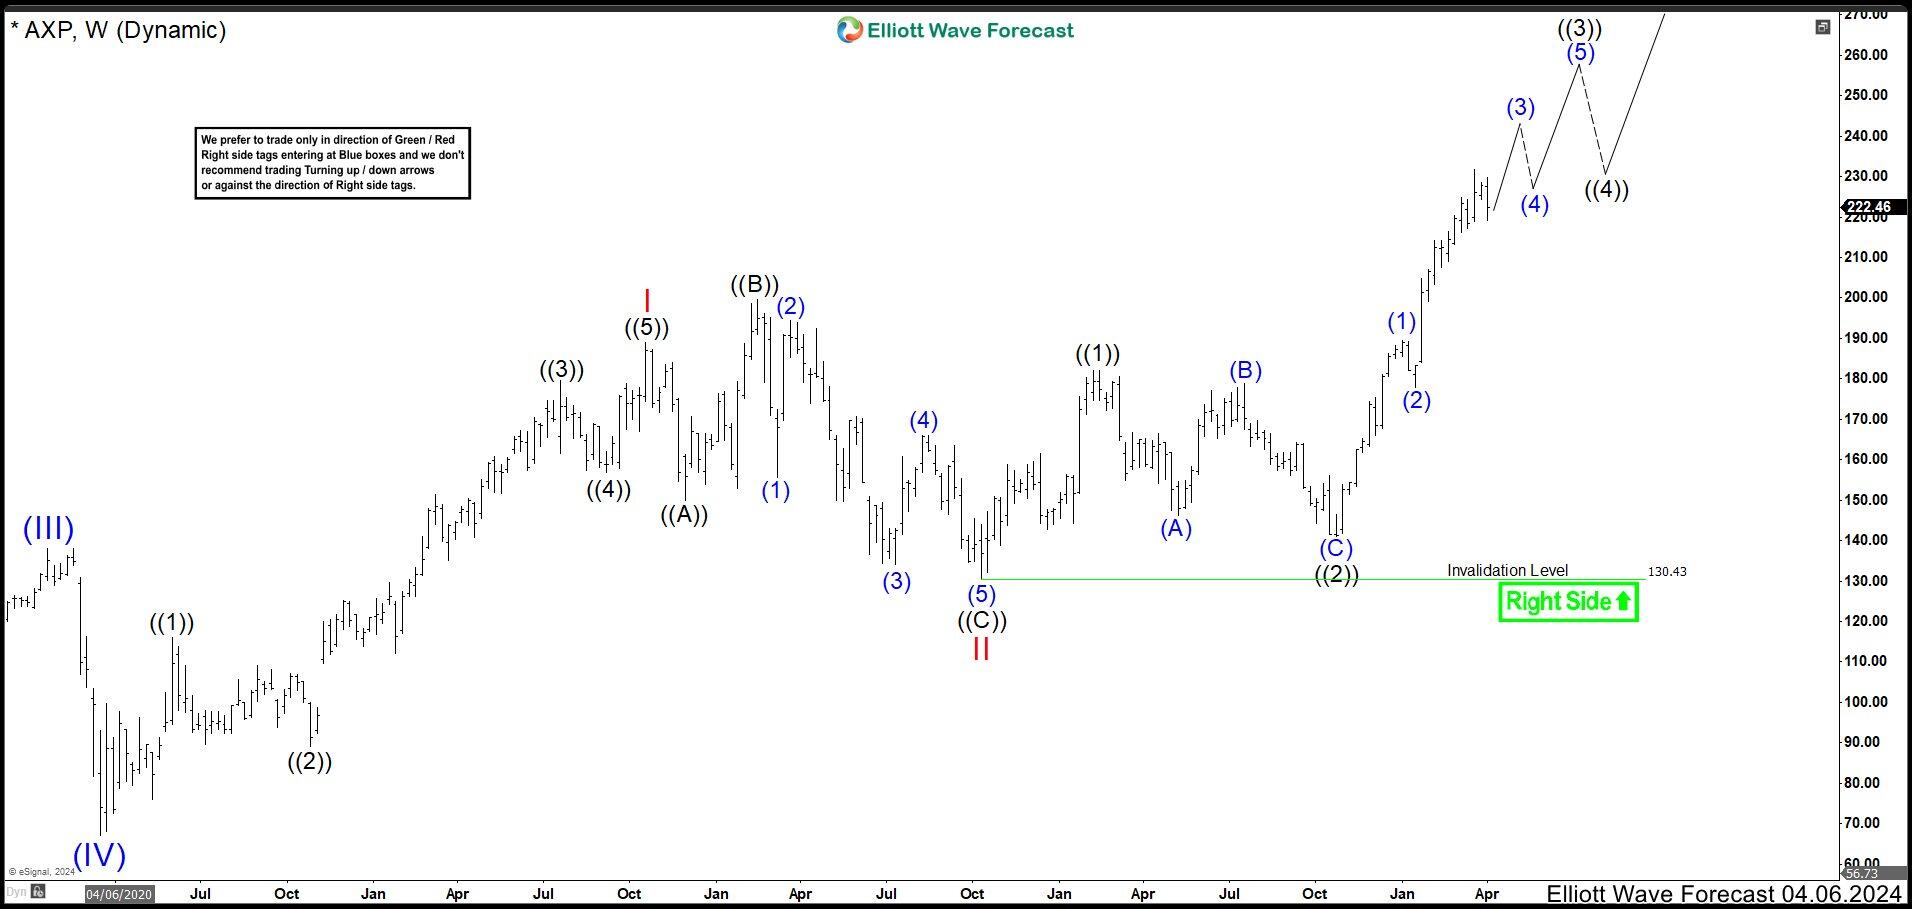
The stock has been building an extension as wave (V) of ((I)). Wave I ended at 189.03 high. Then, wave II built an expanded flat correction ending at 130.65 low. The wave ((1)) of III completed at 182.15 and pullback as a flat correction ended wave ((2)) at 140.91. From here, AXP started a strong rally that was wave ((3)) of III and we were looking for buying opportunities to trade in favor of the trend.

AXP weekly chart August 2024

AXP

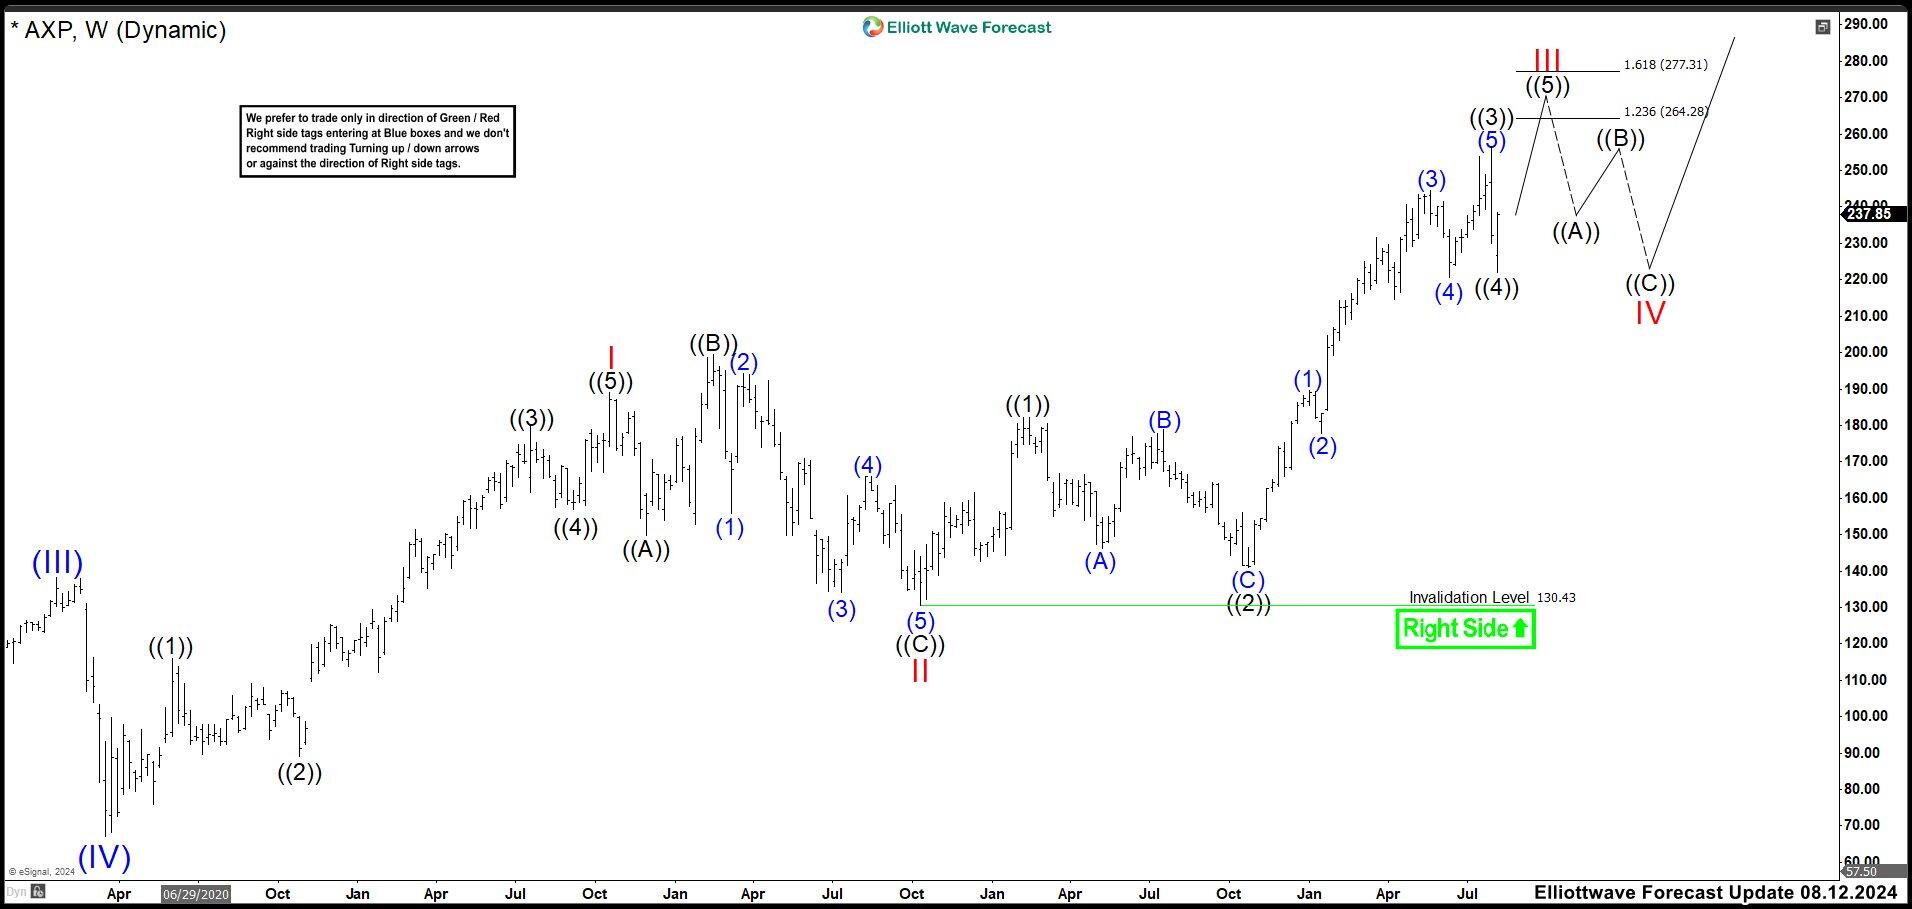
After 4 months, AXP continued the rally as expected. It ended wave (3) of ((3)) at 244.41 high. The pullback as wave (4) finished at 220.74 low and market resumed to the upside in wave (5) of ((3)). This cycle ended at 256.24 high and we had strong pullback as wave ((4)) retesting last wave (4) low around 222.03. The market was trading in wave ((5)) higher. If there was not more extensions, this wave ((5)) of III could reach 264.28 – 277.31 area where AXP could begin a large correction in wave IV.

AXP weekly chart January 2025

AXP

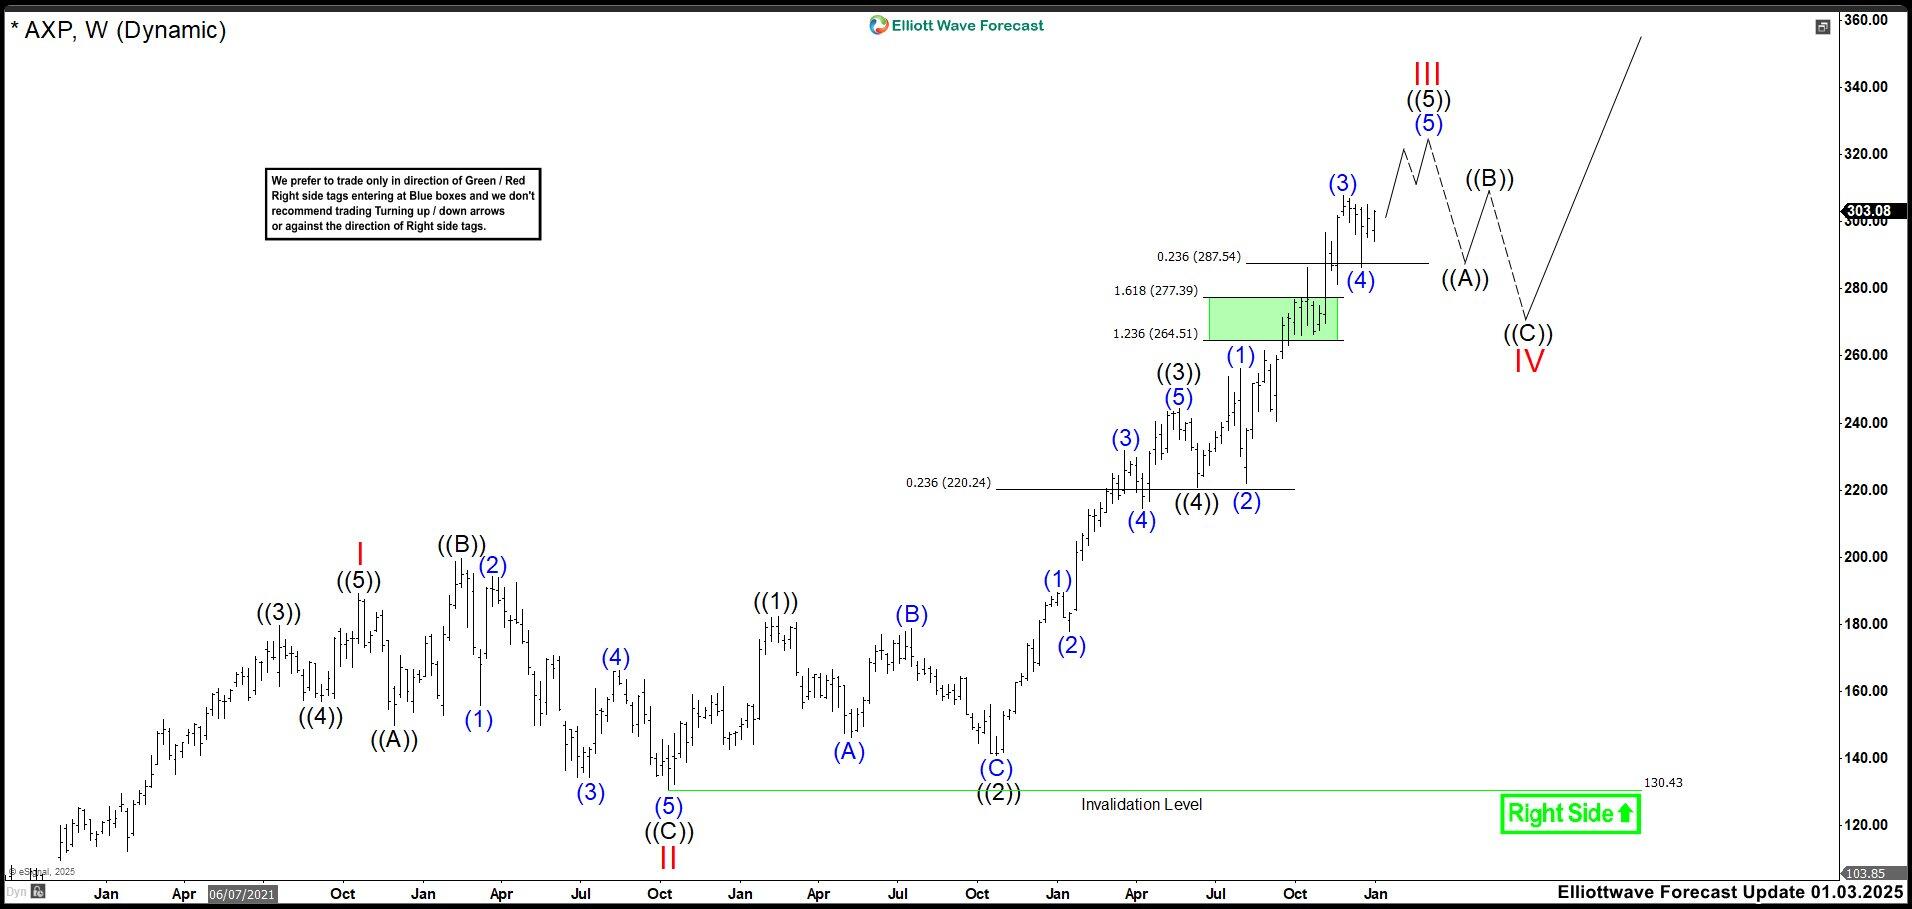
The rally continued as expected hitting the target of 264.28 – 277.31 area. The market has extended the wave ((5)) and the structure looks incomplete. With this extension, we adjusted a little bit the count. Also, we can see how wave 4s pulled back to the typical level of 23.6% Fib retracement of a wave 3. Wave ((4)) retraced to 220.24 and wave (4) to around 287. Currently, AXP is trading in wave (5) and it could reach to 320.00 before starting wave IV correction. We cannot deny more extensions, inclusive we are using a conservative view because AXP could be still trading in wave ((3)). For now, we are going to wait for a reaction lower from around 320.00 to retest 280.00 – 290.00 area and see how the market structure is developing.

Author

Elliott Wave Forecast Team

Elliott Wave Forecast Team

ElliottWave-Forecast.com

More from Elliott Wave Forecast Team
Share:

Editor's Picks

EUR/USD holds lower ground near 1.1850 ahead of EU/ US data

EUR/USD remains in the negative territory for the fourth successive session, trading around 1.1850 in European trading on Friday. A broadly cautious market environment paired with modest US Dollar demand undermines the pair ahead of the Eurozone GDP second estimate and the critical US CPI data. 

GBP/USD keeps losses around 1.3600, awaits US CPI for fresh impetus

GBP/USD holds moderate losses at around 1.3600 in the European session on Friday, though it lacks bearish conviction. The US Dollar remains supported amid softer risk tone and ahead of the US consumer inflation figures due later in the NA session on Friday. 

Gold trims intraday gains to $5,000 as US inflation data loom

Gold retreats from the vicinity of the $5,000 psychological mark, though sticks to its modest intraday gains heading into the European session. Traders now look forward to the release of the US consumer inflation figures for more cues about the Fed policy path. The outlook will play a key role in influencing the near-term US Dollar price dynamics and provide some meaningful impetus to the non-yielding bullion.

US CPI data set to show modest inflation cooling as markets price in a more hawkish Fed

The US Bureau of Labor Statistics will publish January’s Consumer Price Index data on Friday, delayed by the brief and partial United States government shutdown. The report is expected to show that inflationary pressures eased modestly but also remained above the Federal Reserve’s 2% target.

A tale of two labour markets: Headline strength masks underlying weakness

Undoubtedly, yesterday’s delayed US January jobs report delivered a strong headline – one that surpassed most estimates. However, optimism quickly faded amid sobering benchmark revisions.

Solana Price Forecast: Mixed market sentiment caps recovery

Solana (SOL) is trading at $79 as of Friday, following a correction of over 9% so far this week. On-chain and derivatives data indicates mixed sentiment among traders, further limiting the chances of a price recovery.