American Airlines (AAL) finds buyers at the blue box area

In this technical article we’re going to take a quick look at the Elliott Wave charts of American Airlines Group ( $AAL ) stock. As our members know, the stock is trading within the cycle from the 11.63 low. We have been calling for the rally in the stock after 3 waves pull back. Our team recommended members to avoid selling AAL stock, while keep favoring the long side. In the further text we are going to explain the Elliott Wave Forecast.
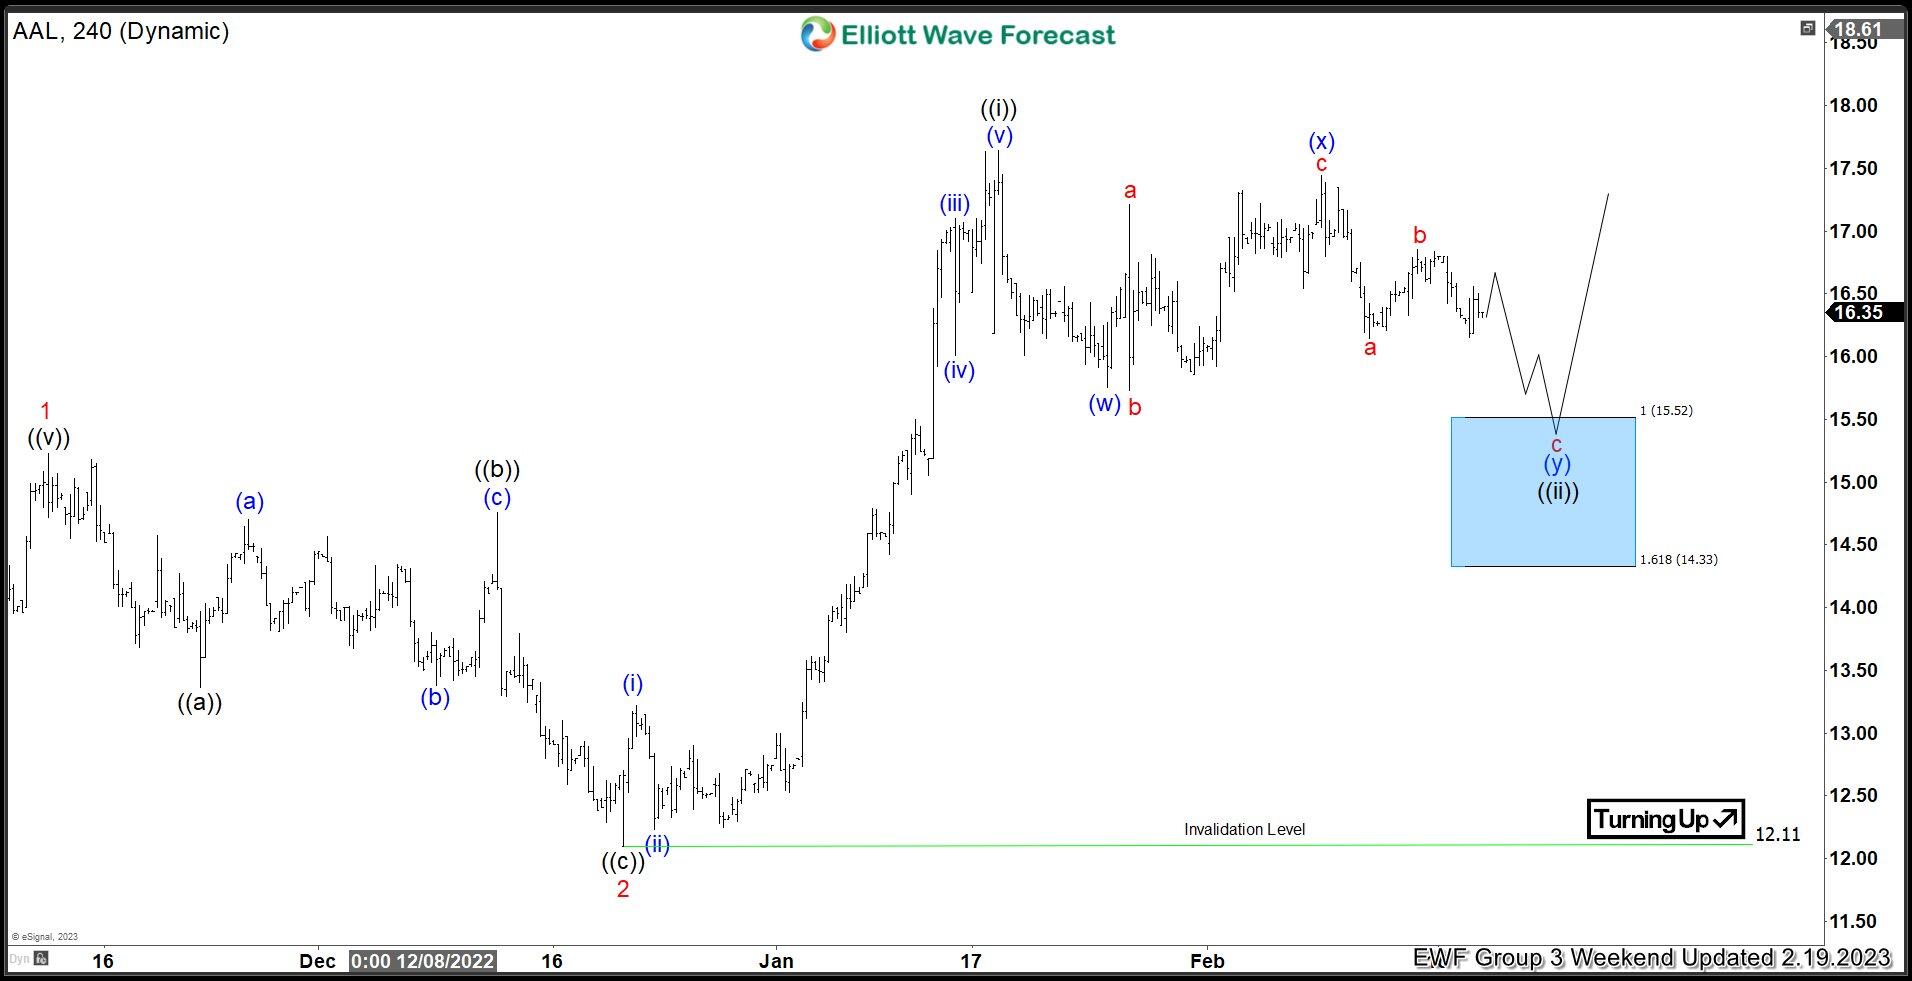
American Airlines (AAL) Elliott Wave 4 hour chart 2.19.2023
Current view suggests the stock is doing correction of the cycle from the 12.11 low. At the moment structure of the pull back looks incomplete, consequently we were calling for another leg down toward 15.52-14.33 area. We don’t recommend selling it and prefer the long side. The stock is expected to find buyers in 3,7,11 swings. We expect to see at least 3 waves bounce from the blue box area or further rally toward new highs ideally.
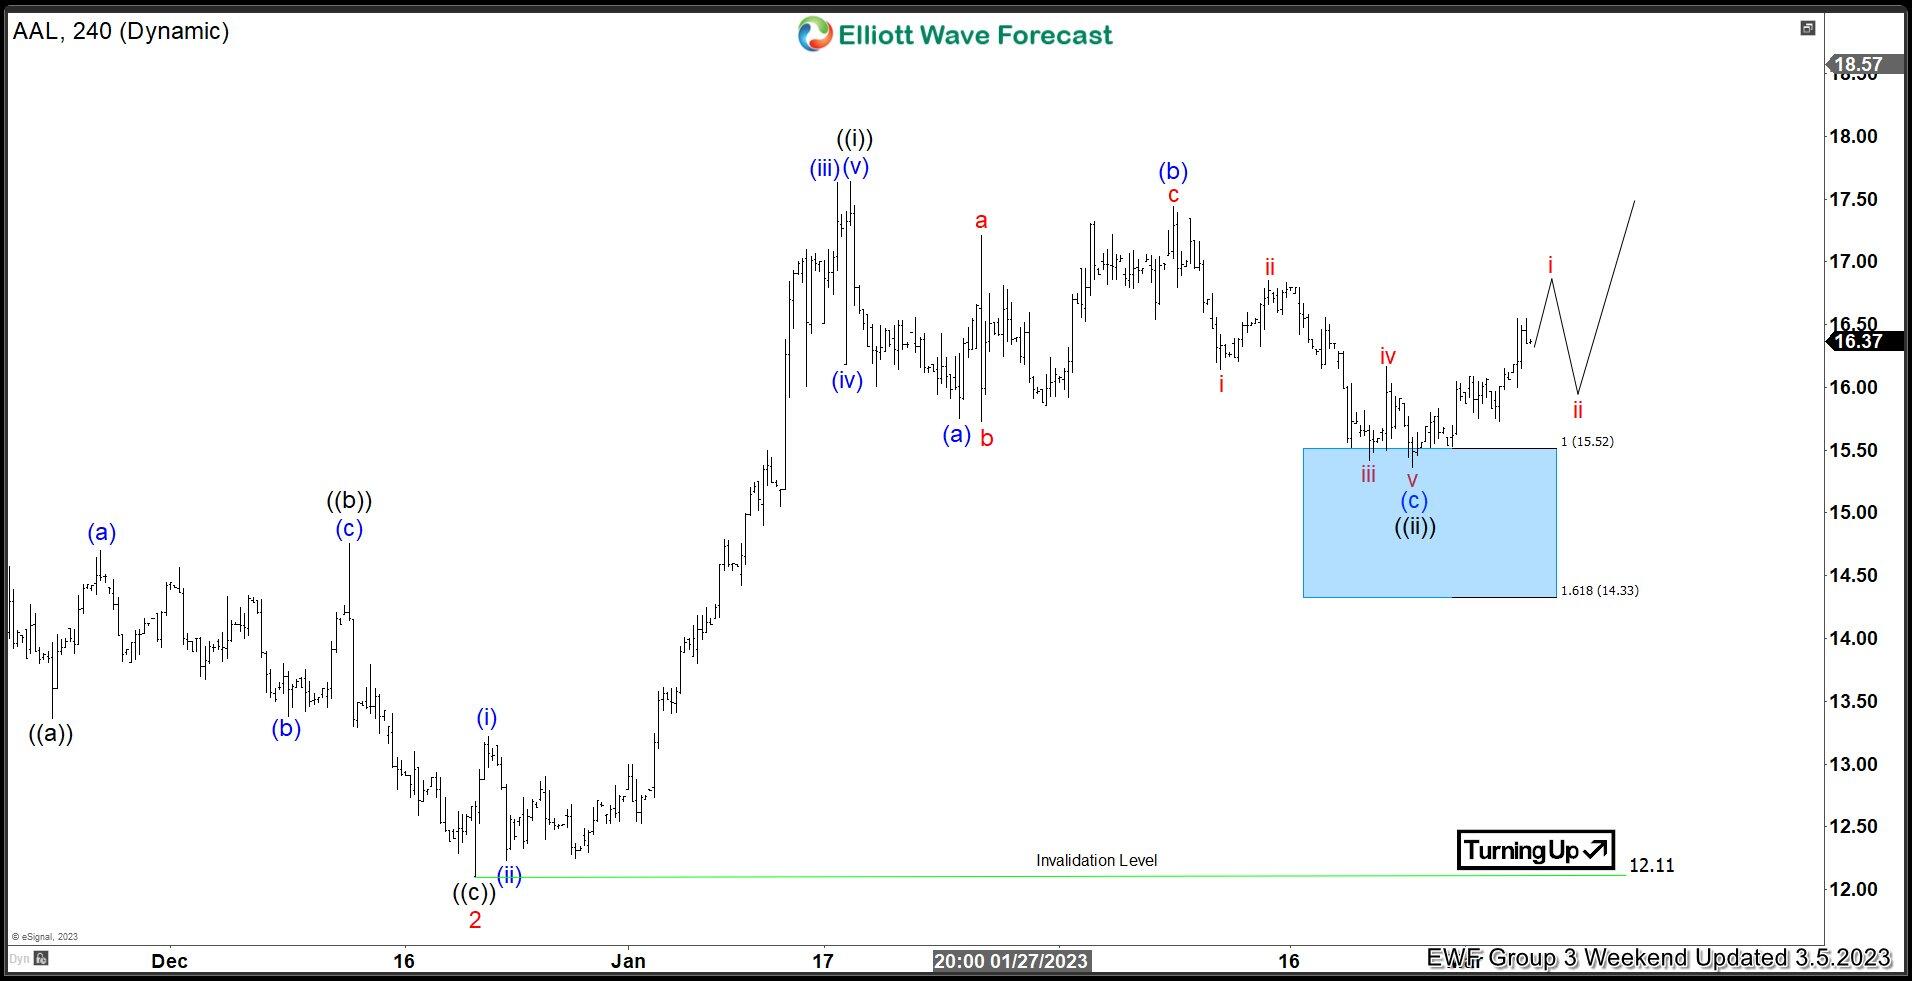
American Airlines (AAL) Elliott Wave 4 hour chart 2.19.2023
The stock made decline toward blue box zone. Pull back reached our target zone at 15.52-14.33. AAL found buyers and we are getting good reaction from there. Rally made enough separation from the lows. Wave ((ii)) looks completed at 15.38 low . As far as the price holds above that low, the stock can be trading higher in ((iii)) toward new highs.
Author

Elliott Wave Forecast Team
ElliottWave-Forecast.com


