AMD Stock Forecast: Advanced Micro Devices to release results on April 27, technical levels to watch
- AMD announces that it will release Q1 2021 results on April 27.
- The semiconductor manufacturer is in focus due to global semiconductor shortages.
- Advanced Micro Devices shares pulled back from highs of $99.23 set in January.

AMD is one of the largest semiconductor manufacturers and is focused on the computing and graphics sector. AMD is one of Intel's main competitors in the desktop and laptop chip market. The company's new Ryzen chips have become a serious option and challenge to Intel. The sector is the subject of much focus as numerous companies complain of semiconductor chip shortages. President Biden has set up a task force to help deal with global supply problems.
Stay up to speed with hot stocks' news!
AMD price prediction
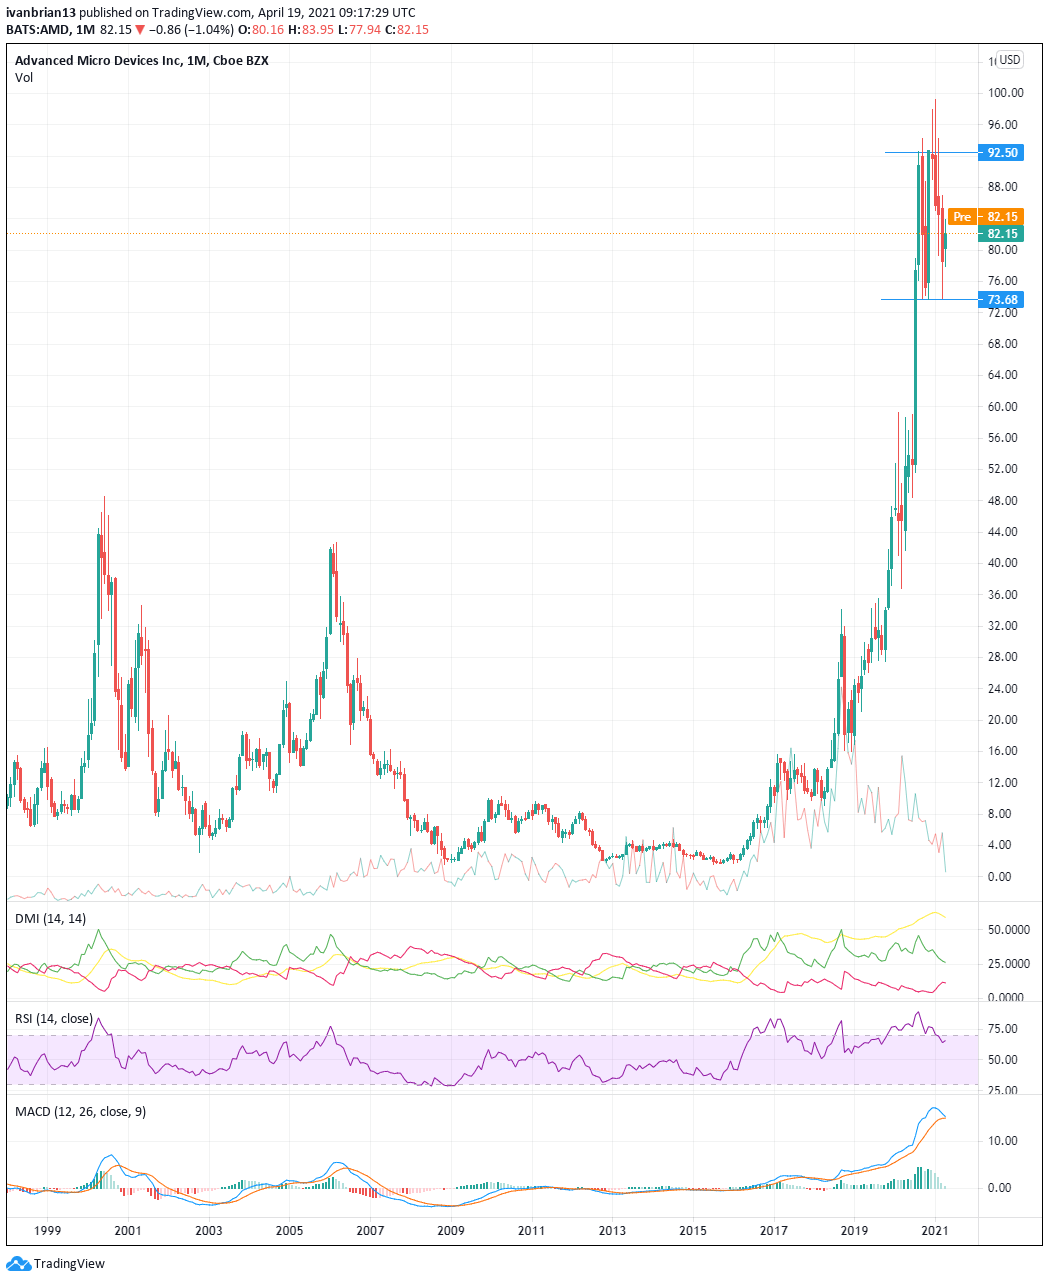
Taking a long time frame gives us some perspective of the longer-term trend we are trading with or against. It is pretty clear that AMD is in a long-term bullish trend, much like the overall market. The move and speed have accelerated recently. Since the price explosion in July 2020 above and through $59.30, AMD has set a new range for itself of $73.92 to $94.25. The Directional Movement Index shows the trend is strong with the yellow line indicating trend strength. A value above 25 indicates a growing trend strength. The RSI has been in overbought territory and the Moving Average Convergence Divergence (MACD) indicator is looking to cross over. Overall, the longer-term trend shows some bullish caution is needed.
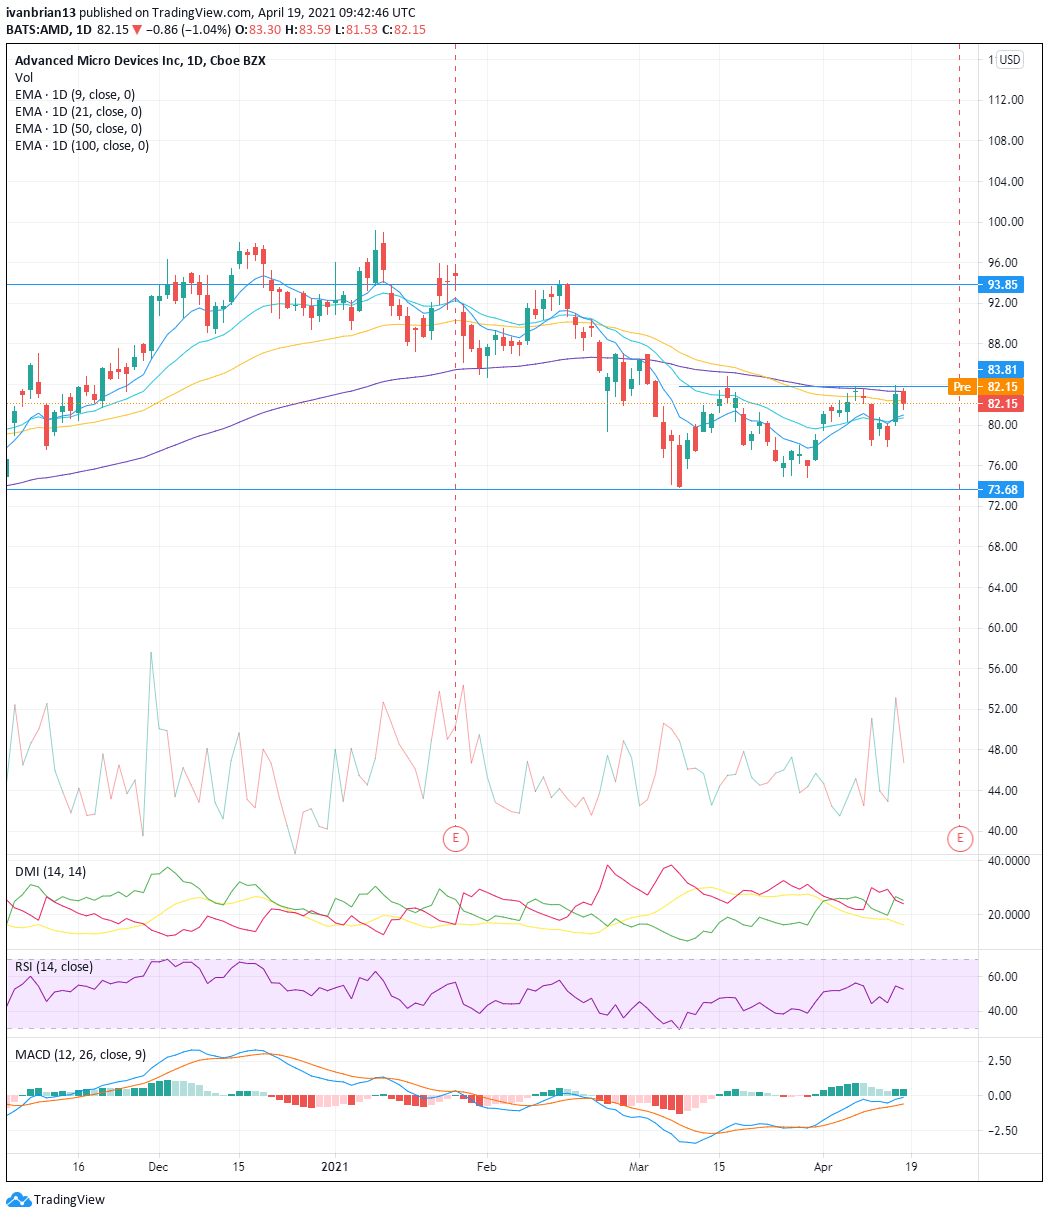
On the daily chart, the picture is slightly more bearish. The DMI has given a sell signal, but in this case it is not a strong signal. The yellow Average Directional Index (ADX) line is not showing a strong trend.
AMD has twice run into resistance from the 100-day moving average and failed both times. The 50-day moving average is also providing some resistance. A break of 9 and 21-day moving averages would lead to a test of $73.68 support. Added to this is the range resistance at $83.81.
If bulls win out and AMD breaks through the 100-day moving average, the next level to target would be $93.85. Taking a long position on a breakout of the $83.81 resistance with confirmation from a break of the 50 and 100-day moving averages would have $93.85 as the target, and using a stop at or near the break point would be wise.
Alternatively, those looking to sell AMD can take a position now but use the above mettrics as their stop or position closure. Breaking $83.81 and the 50 or 100-day moving averages is a stop signal. The first level to target for bears would be the 9 and 21-day moving averages and subsequently the $73.68 support.
At the time of writing, the author has no position in any stock mentioned in this article and no business relationship with any company mentioned. The author has not received compensation for writing this article, other than from FXStreet.
This article is for information purposes only. The author and FXStreet are not registered investment advisors and nothing in this article is intended to be investment advice. It is important to perform your own research before making any investment and take independent advice from a registered investment advisor.
FXStreet and the author do not provide personalized recommendations. The author makes no representations as to accuracy, completeness, or the suitability of this information. FXStreet and the author will not be liable for any errors, omissions or any losses, injuries or damages arising from this information and its display or use. The author will not be held responsible for information that is found at the end of links posted on this page.
Errors and omissions excepted.
Premium
You have reached your limit of 3 free articles for this month.
Start your subscription and get access to all our original articles.
Author

Ivan Brian
FXStreet
Ivan Brian started his career with AIB Bank in corporate finance and then worked for seven years at Baxter. He started as a macro analyst before becoming Head of Research and then CFO.