- AMD is a semiconductor company, one of the sectors suffering from shortages.
- Firm is struggling for momentum as a result of negative sentiment.
- AMD shares suffered on Monday with a loss of 5%.
AMD is one of the largest semiconductors manufacturers and is focused on the computing and graphics sector. AMD is one of Intel's main competitors in the pc and laptop chip market.
Stay up to speed with hot stocks' news!
AMD stock price target
Taking a long time frame gives us some perspective of the longer-term trend we are trading with or against. It is pretty clear that AMD is in a long-term bullish trend. Much like the overall market. The move and speed have accelerated recently. Since the price explosion in July 2020 above and through $59.30, AMD has set a new range for itself of $73.92 to $94.25. Yes, we have some spikes higher, but on the weekly chart $94.25 is stronger with many weekly closes at or near this price level. Now that we have established the range we are currently in, digging deeper into the daily chart gives us some more information.
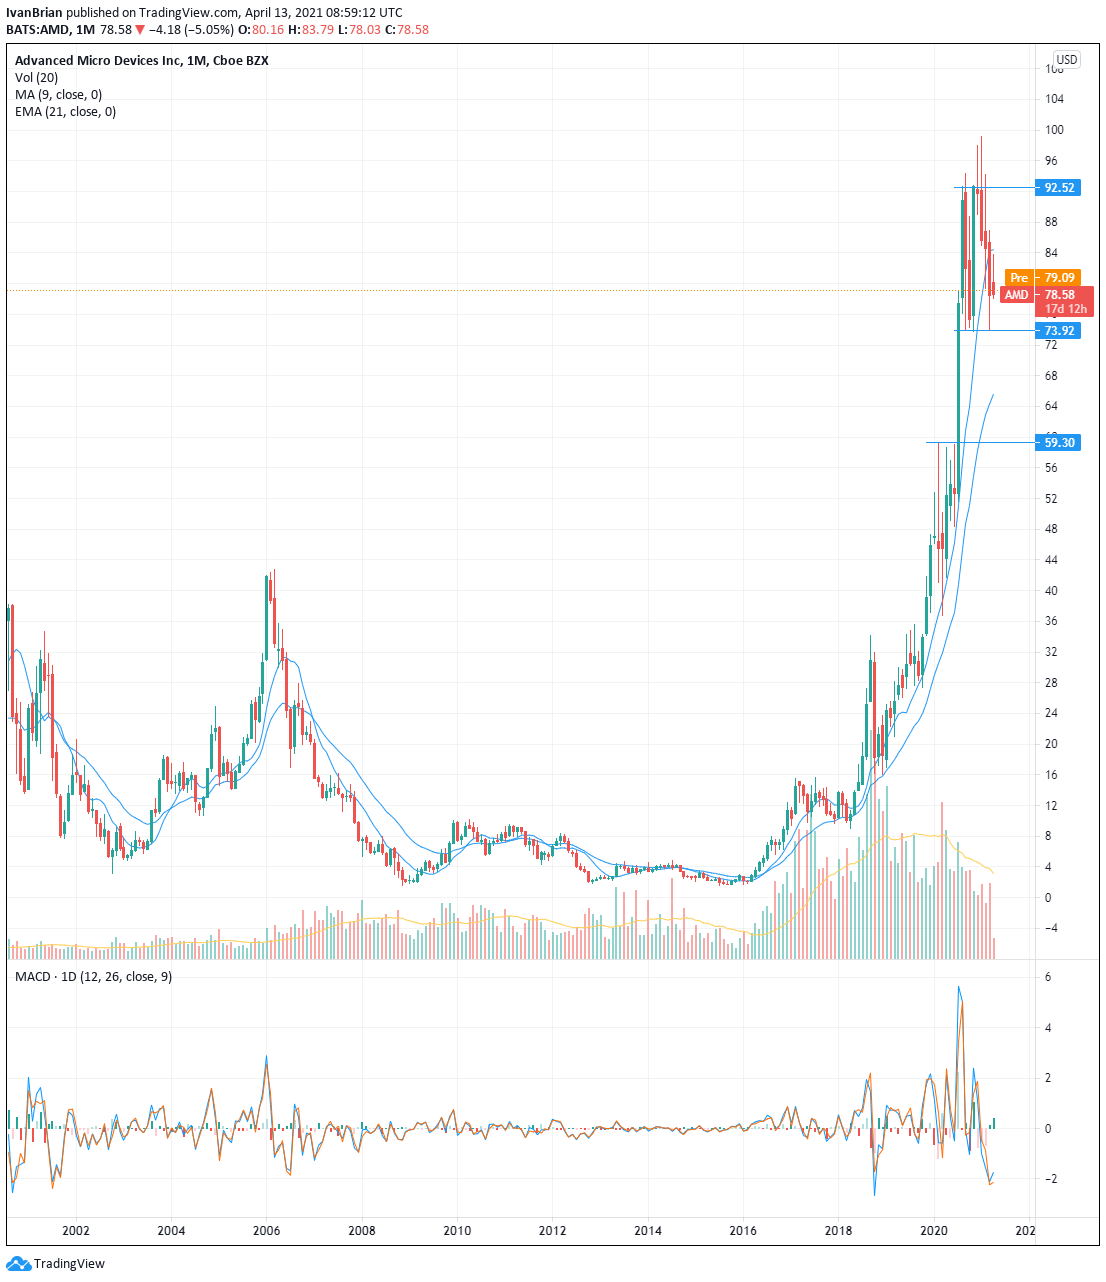
The daily chart does show that we have broken to the upside more than the downside of our range. This is understandable and adds to the overall bullishness. AMD is trying to break upward not downward. However, the failure has led AMD back toward the bottom of the range with a possible test of $73.92 imminent.
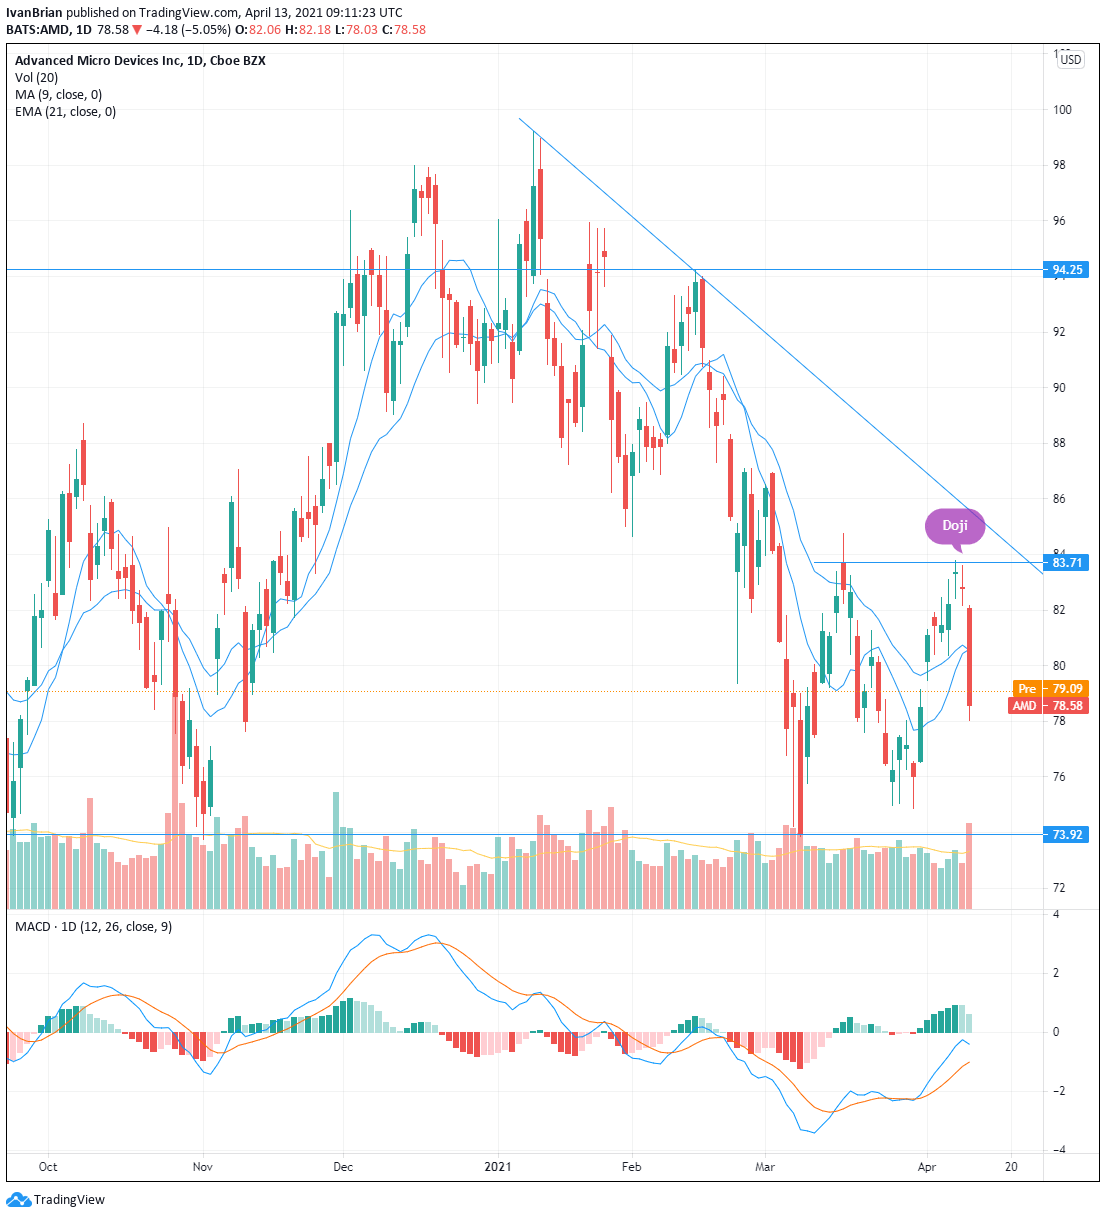
The daily chart looks ugly for bulls after yesterday's nasty candle, which followed from the bearish doji last week. On Monday, AMD lost 5%, breaking through the 9 and 21-day moving averages and so turning bearish in the short term. Taking a long position is out of the question for now. Tuesday's price action will give further clues as to how to position ourselves or whether to wait. It is not always necessary to have a position. Better to wait until some strong signal shows rather than gambling.
The daily chart is still showing that longs are slightly more favoured. The MACD crossed over on March 31, giving a buy signal for AMD shares.
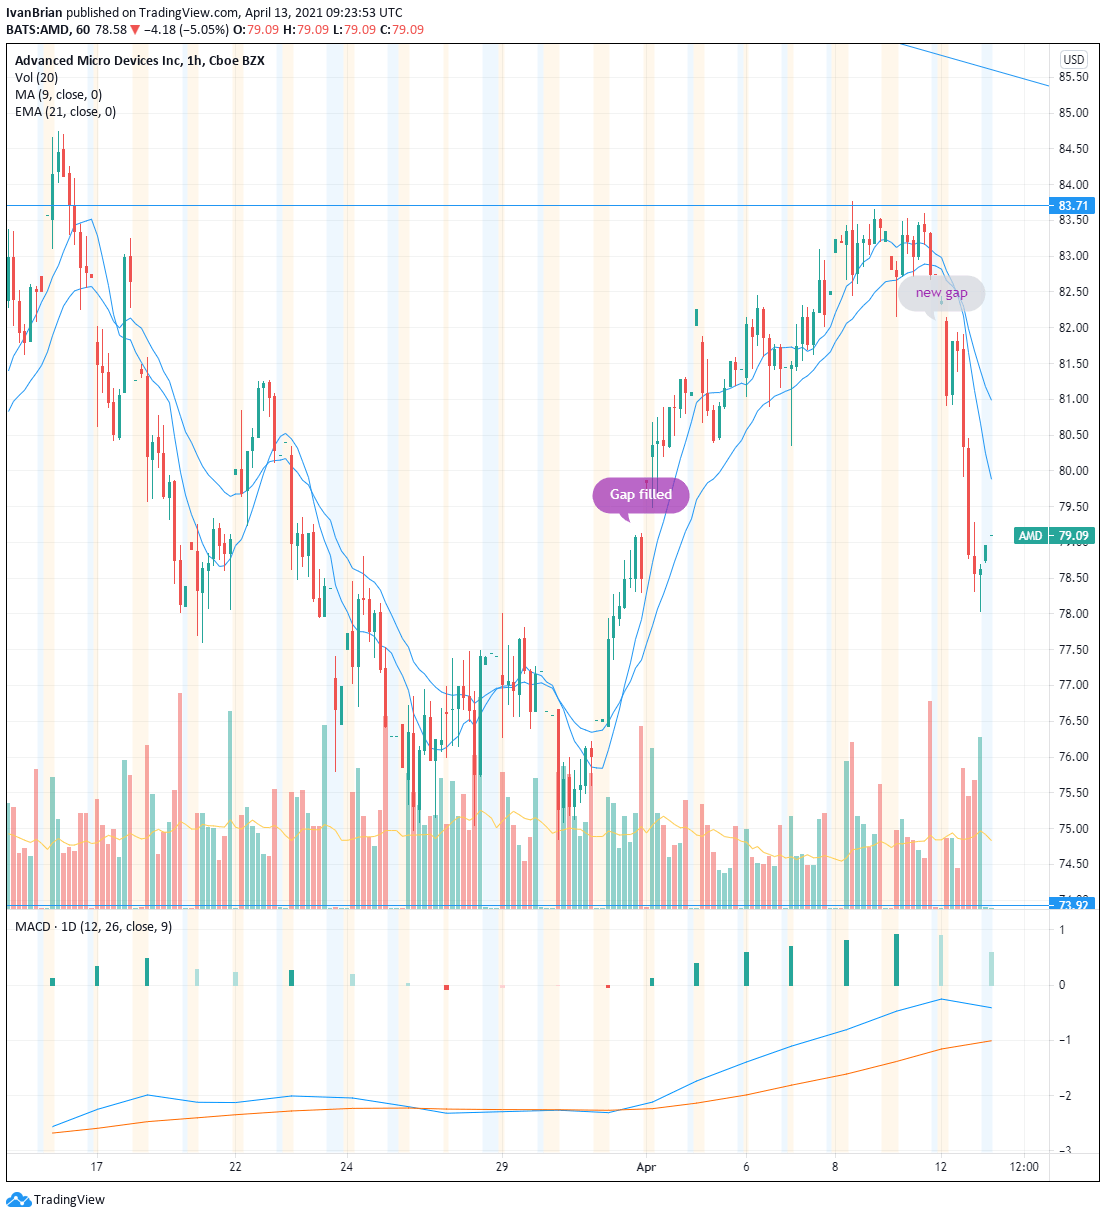
The hourly chart gives further clues. AMD has now filled the gap from March 31 to April 1. In the process, the stock has created a new gap up at the $82.10 to $82.50 level. Yesterday, toward the close, AMD put in a long shadow candle and closed up one dollar from the lows, so possibly this is some bargain hunters entering.
Nothing is yet strong enough to enter a new position. However, the bullish sentiment is stronger. Once or if the hourly short-term moving averages are retaken, look for the same to happen on the daily chart. This can be a catalyst to buy AMD. A breakout of $83.71 is another bullish signal.
If AMD fails and trades lower, then trading a breakout of the range at $73.92 would have a target of $71.63 (the gap from 28/29 July 2020) and then $62.33 (the gap from earlier in July 2020). Once or if AMD trades toward the $73.92 low of the current range, look for further indicators to decide whether to take long or short positions such as RSI, MACD, etc.
For now, the long-term trend is bullish and so is the broader market. It is always easier and safer to trade with the trend. This means that looking for levels and signals to go long is favoured.
At the time of writing, the author has no position in any stock mentioned in this article and no business relationship with any company mentioned. The author has not received compensation for writing this article, other than from FXStreet.
This article is for information purposes only. The author and FXStreet are not registered investment advisors and nothing in this article is intended to be investment advice. It is important to perform your own research before making any investment and take independent advice from a registered investment advisor.
FXStreet and the author do not provide personalized recommendations. The author makes no representations as to accuracy, completeness, or the suitability of this information. FXStreet and the author will not be liable for any errors, omissions or any losses, injuries or damages arising from this information and its display or use. The author will not be held responsible for information that is found at the end of links posted on this page.
Errors and omissions excepted.
Information on these pages contains forward-looking statements that involve risks and uncertainties. Markets and instruments profiled on this page are for informational purposes only and should not in any way come across as a recommendation to buy or sell in these assets. You should do your own thorough research before making any investment decisions. FXStreet does not in any way guarantee that this information is free from mistakes, errors, or material misstatements. It also does not guarantee that this information is of a timely nature. Investing in Open Markets involves a great deal of risk, including the loss of all or a portion of your investment, as well as emotional distress. All risks, losses and costs associated with investing, including total loss of principal, are your responsibility. The views and opinions expressed in this article are those of the authors and do not necessarily reflect the official policy or position of FXStreet nor its advertisers. The author will not be held responsible for information that is found at the end of links posted on this page.
If not otherwise explicitly mentioned in the body of the article, at the time of writing, the author has no position in any stock mentioned in this article and no business relationship with any company mentioned. The author has not received compensation for writing this article, other than from FXStreet.
FXStreet and the author do not provide personalized recommendations. The author makes no representations as to the accuracy, completeness, or suitability of this information. FXStreet and the author will not be liable for any errors, omissions or any losses, injuries or damages arising from this information and its display or use. Errors and omissions excepted.
The author and FXStreet are not registered investment advisors and nothing in this article is intended to be investment advice.


Recommended content
Editors’ Picks

AUD/USD holds below 0.6400 amid signs of easing US-China tensions
The AUD/USD pair trades in negative territory near 0.6390 during the early Asian session on Monday. The US Dollar edges higher against the Aussie amid signs of easing US-China tensions. China will hold a press conference about policies and measures on stabilizing employment and ensuring stable growth on Monday, which will be closely watched by traders.

USD/JPY holds steady above mid-143.00s amid Trump's uncertainty
USD/JPY kicks off the week on a subdued note and consolidates above mid-143.00s amid mixed cues. Investors push back expectations for an immediate BoJ rate hike amid rising economic risks from US tariffs, which acts as a headwind for the JPY and lends support to the pair amid a modest USD uptick.

Gold edges lower to near $3,300 as US-China trade tensions ease
Gold price loses ground to near $3,310 in Monday’s early Asian session, down 0.30% on the day. De-escalating trade tensions between the US and China underpins the Gold price. The fears of the US recession might help limit the Gold’s losses.

Week ahead: US GDP, inflation and jobs in focus amid tariff mess
Barrage of US data to shed light on US economy as tariff war heats up. GDP, PCE inflation and nonfarm payrolls reports to headline the week. Bank of Japan to hold rates but may downgrade growth outlook. Eurozone and Australian CPI also on the agenda, Canadians go to the polls.
Week ahead: US GDP, inflation and jobs in focus amid tariff mess – BoJ meets
Barrage of US data to shed light on US economy as tariff war heats up. GDP, PCE inflation and nonfarm payrolls reports to headline the week. Bank of Japan to hold rates but may downgrade growth outlook. Eurozone and Australian CPI also on the agenda, Canadians go to the polls.

The Best brokers to trade EUR/USD
SPONSORED Discover the top brokers for trading EUR/USD in 2025. Our list features brokers with competitive spreads, fast execution, and powerful platforms. Whether you're a beginner or an expert, find the right partner to navigate the dynamic Forex market.