|

AMD Elliott Wave calling the rally after ABC pull back

. In this technical article we’re going to look at the Elliott Wave charts of  AMD Stock  published in members area of the website.  As our followers know, the stock is trading within the cycle from the 75.21 low.  Recently, we forecasted the end of the short-term pull back (B) in blue and called for a further rally in the stock. In the following text, we’ll explain the Elliott Wave analysis and present target areas.

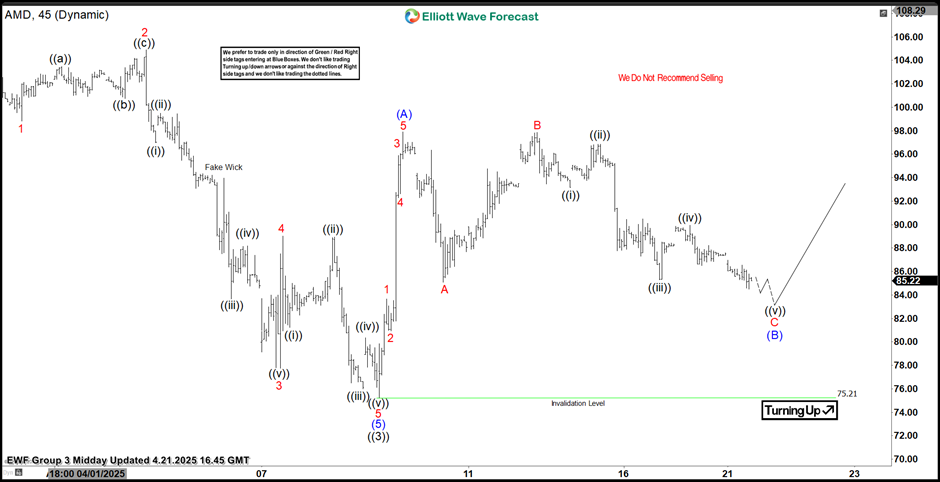
AMD Elliott Wave one hour chart 04.21.2025

AMD stock is showing a three-wave pullback against the 75.21 low. The correction already displays enough swings, and we expect it to complete at any moment. Our members know that in such cases we can easily identify the reversal area by measuring the Equal Legs zone (A related to B), which comes in at the 85.0–82.0 area. We expect buyers to appear within the mentioned zone and to see a further rally in the stock from there.

Chart

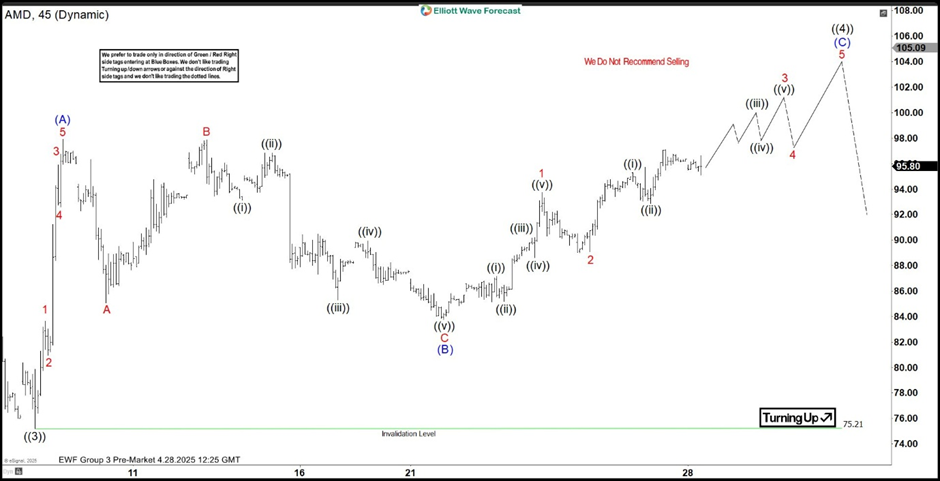
AMD Elliott Wave one hour chart 04.28.2025

AMD found buyers as expected at the Equal Legs area (85.0–82.0) and has delivered a decent rally so far. Now, we would like to see a break above the April 9th peak to confirm further extension to the upside toward the 105.82+ zone.

Chart

Author

Elliott Wave Forecast Team

Elliott Wave Forecast Team

ElliottWave-Forecast.com

More from Elliott Wave Forecast Team
Share:

Markets move fast. We move first.

Orange Juice Newsletter brings you expert driven insights - not headlines. Every day on your inbox.

By subscribing you agree to our Terms and conditions.

Editor's Picks

EUR/USD ticks lower following the release of FOMC Minutes

The US Dollar found some near-term demand following the release of the FOMC meeting minutes, with the EUR/USD pair currently piercing the 1.1750 threshold. The document showed officials are still willing to trim interest rates. Meanwhile, thinned holiday trading keeps major pairs confined to familiar levels.

GBP/USD remains sub- 1.3500, remains in the red

The GBP/USD lost traction early in the American session, maintaining the sour tone and trading around 1.3460 following the release of the FOMC meeting minutes. Trading conditions remain thin ahead of the New Year holiday, limiting the pair's volatility.

Gold stable above $4,350 as the year comes to an end

Gold price got to recover some modest ground on Tuesday, holding on to intraday gains and changing hands at $4,360 a troy ounce in the American afternoon. The bright metal showed no reaction to the release of the FOMC December meeting minutes.

Ethereum: ETH holds above $2,900 despite rising selling activity

Ethereum (ETH) held the $2,900 level despite seeing increased selling pressure over the past week. The Exchange Netflow metric showed deposits outweighed withdrawals by about 400K ETH. The high value suggests rising selling activity amid the holiday season.

Economic outlook 2026-2027 in advanced countries: Solidity test

After a year marked by global economic resilience and ending on a note of optimism, 2026 looks promising and could be a year of solid economic performance. In our baseline scenario, we expect most of the supportive factors at work in 2025 to continue to play a role in 2026.

Crypto market outlook for 2026

Year 2025 was volatile, as crypto often is.  Among positive catalysts were favourable regulatory changes in the U.S., rise of Digital Asset Treasuries (DAT), adoption of AI and tokenization of Real-World-Assets (RWA).