AMCOR PLC – AMC Elliott Wave Technical Analysis TradingLounge
Greetings, Our Elliott Wave analysis today updates the Australian Stock Exchange (ASX) with AMCOR PLC – AMC. We see ASX:AMC possibly pushing a little lower in the short term, then possibly starting to push higher with a 3-grey wave.
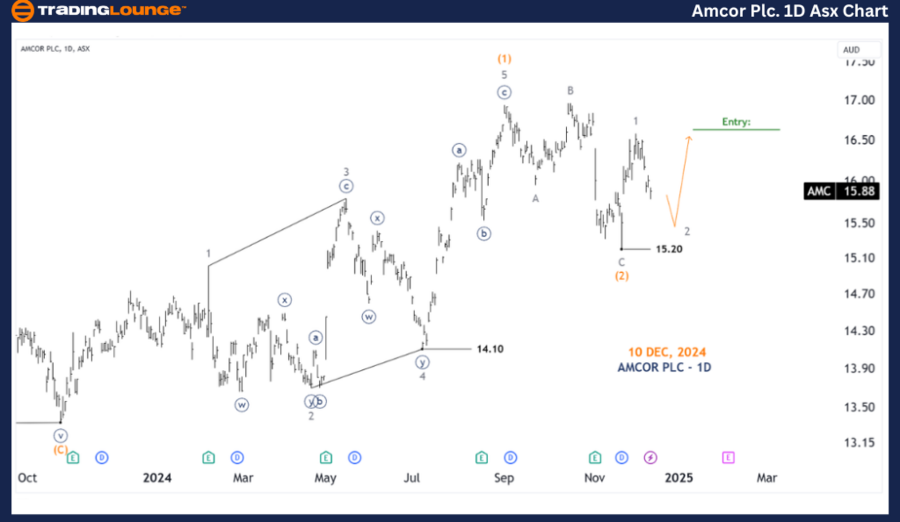
AMCOR PLC – AMC one day chart (semilog scale) analysis
Function: Major trend (Intermediate degree).
Mode: Motive.
Structure: Impulse.
Position: Wave 2-grey of Wave (3)-orange.
Details: Wave 1-grey has ended, and wave 2-grey is pushing a little lower. Then wave 3-grey can come back to push higher. We can also place a pending buy position at the top of wave 1-grey.
Invalidation point: 15.20.
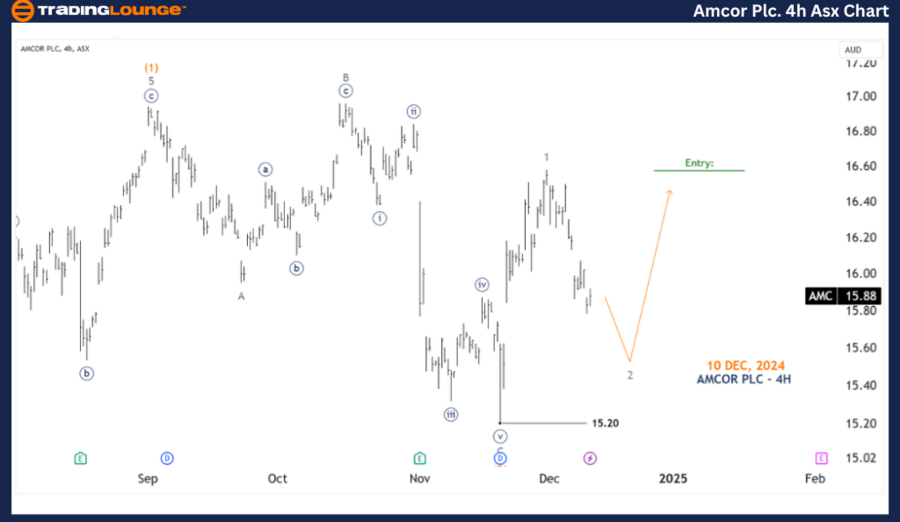
AMCOR PLC – AMC four-hour chart analysis
Function: Major trend (Minor degree, grey).
Mode: Motive.
Structure: Impulse.
Position: Wave 2-grey.
Details: Looking closer since the low at 15.20 wave 1-grey has just completed recently, and wave 2-grey is pushing a little lower, as long as it does not push lower than 15.20 then the view that wave 3-grey will return later is still valid. We can also place a waiting position to buy above the top of wave 1-grey.
Invalidation point: 15.20.
Conclusion:
Our analysis, forecast of contextual trends, and short-term outlook for AMCOR PLC – AMC aim to provide readers with insights into the current market trends and how to capitalize on them effectively. We offer specific price points that act as validation or invalidation signals for our wave count, enhancing the confidence in our perspective. By combining these factors, we strive to offer readers the most objective and professional perspective on market trends.
Technical analyst: Hua (Shane) Cuong, CEWA-M (Master’s Designation).
AMCOR PLC – AMC chart analysis [Video]
As with any investment opportunity there is a risk of making losses on investments that Trading Lounge expresses opinions on.
Historical results are no guarantee of future returns. Some investments are inherently riskier than others. At worst, you could lose your entire investment. TradingLounge™ uses a range of technical analysis tools, software and basic fundamental analysis as well as economic forecasts aimed at minimizing the potential for loss.
The advice we provide through our TradingLounge™ websites and our TradingLounge™ Membership has been prepared without considering your objectives, financial situation or needs. Reliance on such advice, information or data is at your own risk. The decision to trade and the method of trading is for you alone to decide. This information is of a general nature only, so you should, before acting upon any of the information or advice provided by us, consider the appropriateness of the advice considering your own objectives, financial situation or needs. Therefore, you should consult your financial advisor or accountant to determine whether trading in securities and derivatives products is appropriate for you considering your financial circumstances.
Recommended content
Editors’ Picks

EUR/USD attacks 1.0800 ahead of EU inflation data
EUR/USD is battling 1.0800 in the early European session on Tuesday, undermined by the latest US Dollar bounce. Traders keenly await the EU inflation data and the US jobs survey for further impetus as US President Trump's 'reciprocal tariffs' announcement looms on Wednesday.

GBP/USD treads water above 1.2900 ahead of US data, tariffs
GBP/USD is trading on the defensive while holding above 1.2900 in Tuesday's European trading. The pair loses ground amid a modest US Dollar uptick as traders resort to repositioning in the lead-up to the top-tier US economic data releases and Wednesday's tariffs announcements.

Gold price eases from record high; bullish bias remains amid worries over Trump's tariffs
Gold price retreats slightly after touching a fresh all-time high on Tuesday as bulls pause for a breather and opt to wait for US President Donald Trump's reciprocal tariffs announcement. Adding to this, a positive tone around the Asian equity markets also acts as a headwind for the commodity amid overbought conditions on the daily chart.

PEPE could rally to double digits if it breaks above its key resistance level
Pepe memecoin approaches its descending trendline, trading around $0.000007 on Tuesday; a breakout indicates a bullish move ahead. Moreover, PEPE's long-to-short ratio supports a bullish thesis as bullish bets among the traders reach the highest over a month.

Is the US economy headed for a recession?
Leading economists say a recession is more likely than originally expected. With new tariffs set to be launched on April 2, investors and economists are growing more concerned about an economic slowdown or recession.

The Best brokers to trade EUR/USD
SPONSORED Discover the top brokers for trading EUR/USD in 2025. Our list features brokers with competitive spreads, fast execution, and powerful platforms. Whether you're a beginner or an expert, find the right partner to navigate the dynamic Forex market.