- AMC stock suffers a sharp 7%-plus fall on Wednesday, closing at $17.34.
- AMC now accepts Dogecoin and Shiba Inu on AMC's mobile app.
- AMC stock fell sharply in 2022, down 36% YTD.
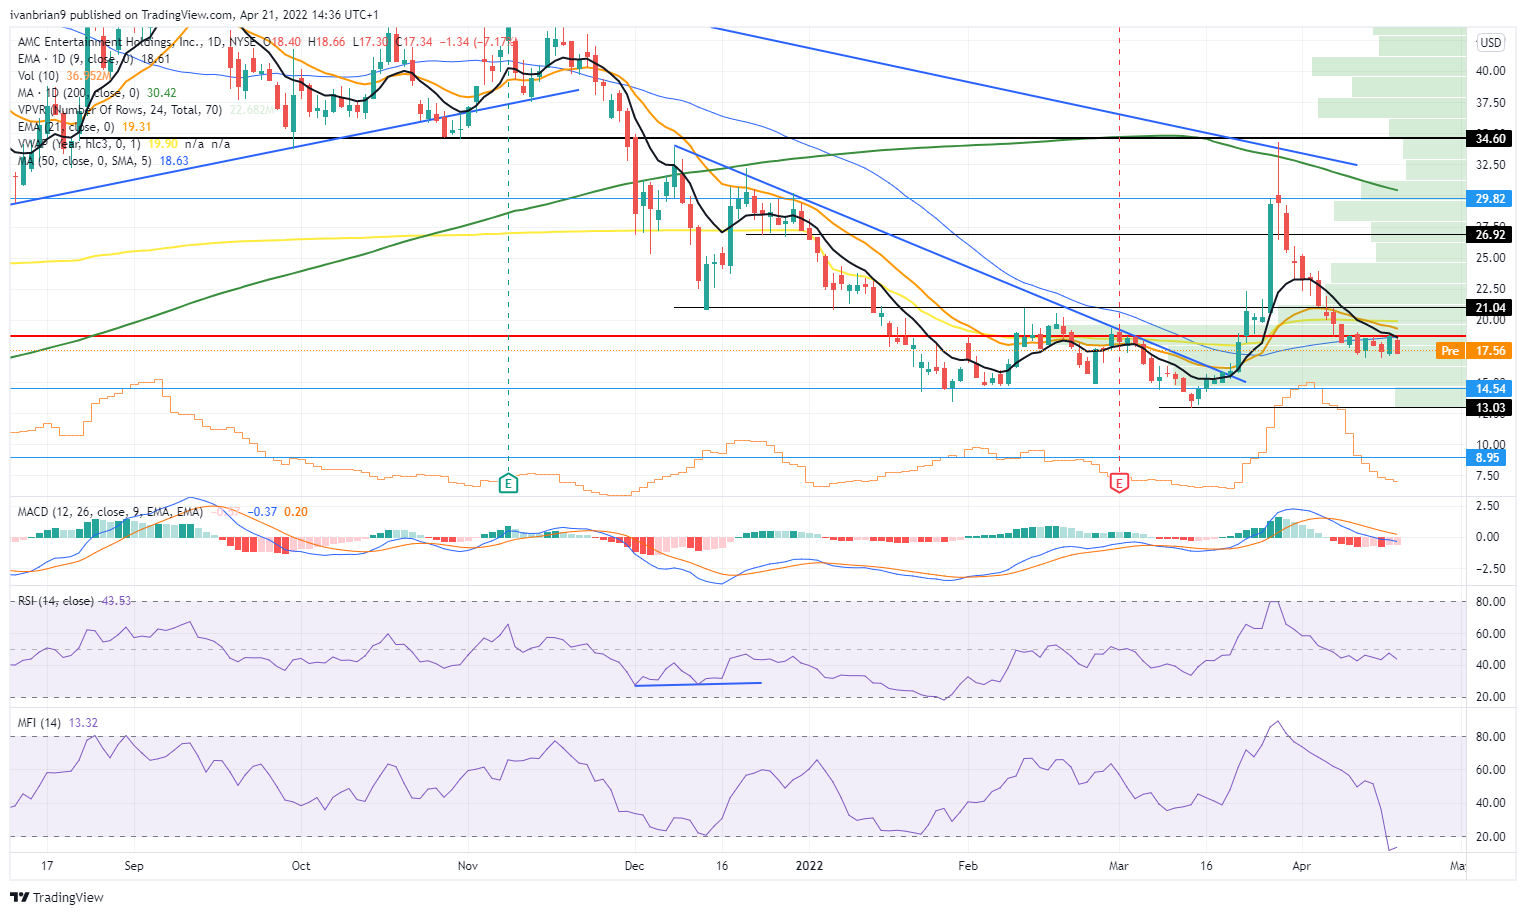
AMC remains the king of social media, but the stock itself is failing to excite as it suffers a gradual decline in sentiment and strength. AMC stock surged after its investment in Hycroft Mining (HYMC) with AMC stock trading as high as $34.33 at the end of March. Since then it has largely been one way traffic, and as of Wednesday's close AMC stock finds itself almost 50% lower from those highs. The reason as ever can be put down to falling momentum, both in terms of price and social media mentions. Trading AMC and other meme stocks largely concerns momentum trading, so knowing when it is rising and falling is key.
Classic signs of rising stock momentum we look for are obvious social media site mentions, volume spikes and price spikes of course. How to spot falling momentum and know when to get out of momentum plays is definitely more tricky. Some obvious signs are falling social media mentions, falling volume and the regular session price not reaching premarket highs. Also the opening price is close to the high of the day, while the closing price is near the low of the day's range.
AMC Stock News
AMC is a constant near the top of social media mentions, and that has not changed despite the recent price falls. The last major spike was down to the investment in Hycroft Mining (HYMC). This created a frenzy, but another key sign to watch for in momentum plays is when a price spike ends at a lower high than the last price spike. In this case AMC spiked to $34.33, which as we can see from the chart below failed to break the downtrend line. We then saw 13 down days out of the next 16 sessions. AMC not only failed at the downtrend line, it also failed at the 200-day moving average.
While many of you are in AMC for more emotional reasons, we would always urge a lack of emotion when trading. This is not an us versus hedge fund crusade or an us versus short seller crusade. This is about making money for yourself, plain and simple. The AMC investment in HYMC was quite small, and despite HYMC stock surging, it was never going to yield significant cash to justify AMC's stock price rising so much. Once momentum dropped off, the resulting fall off was inevitable.
AMC Stock Forecast: Expect the bounce
Right now, AMC is just testing the $17 support, but this looks more and more like it may break in the near term. Right now though the Money Flow Index (MFI) has moved into an oversold area, but the Relative Strength Index (RSI) is not confirming this move. That makes us cautious of issuing a more bearish call – well, that and the sheer size of the fall over the last two weeks. There is a 50% chance we should see at least some small bounce.
AMC stock chart, daily
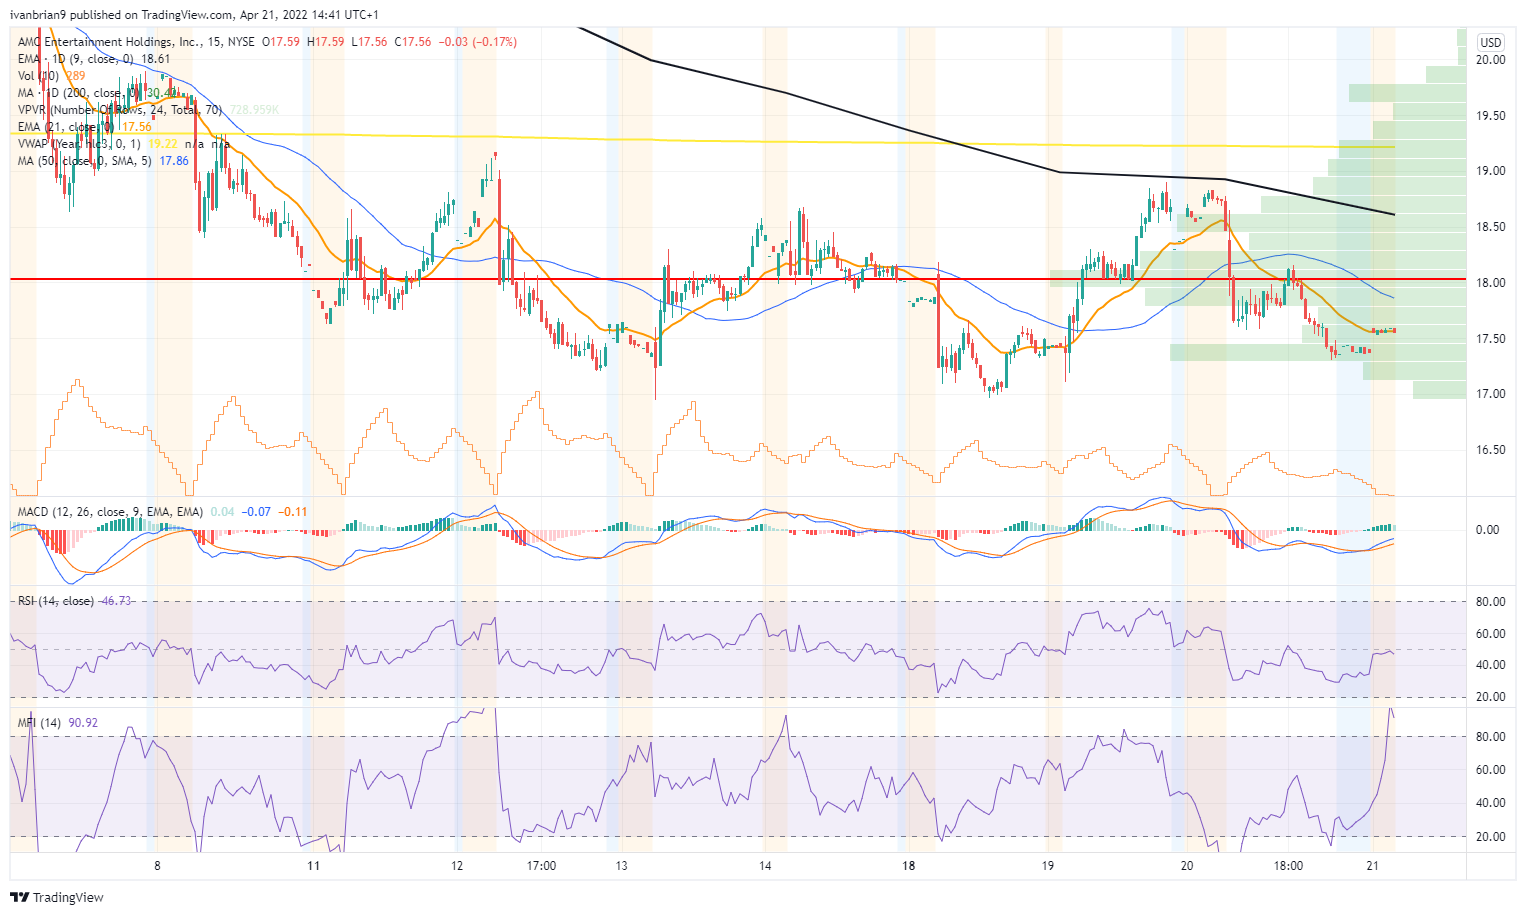
The short-term, 15-minute chart shows us some key levels for intraday trading. Volume at $17 is high, so this is our support on daily and intraday time frames. AMC can bounce through the volume gap up to $18 where again there is a large equilibrium volume profile.
AMC stock chart, 15-minute
Information on these pages contains forward-looking statements that involve risks and uncertainties. Markets and instruments profiled on this page are for informational purposes only and should not in any way come across as a recommendation to buy or sell in these assets. You should do your own thorough research before making any investment decisions. FXStreet does not in any way guarantee that this information is free from mistakes, errors, or material misstatements. It also does not guarantee that this information is of a timely nature. Investing in Open Markets involves a great deal of risk, including the loss of all or a portion of your investment, as well as emotional distress. All risks, losses and costs associated with investing, including total loss of principal, are your responsibility. The views and opinions expressed in this article are those of the authors and do not necessarily reflect the official policy or position of FXStreet nor its advertisers. The author will not be held responsible for information that is found at the end of links posted on this page.
If not otherwise explicitly mentioned in the body of the article, at the time of writing, the author has no position in any stock mentioned in this article and no business relationship with any company mentioned. The author has not received compensation for writing this article, other than from FXStreet.
FXStreet and the author do not provide personalized recommendations. The author makes no representations as to the accuracy, completeness, or suitability of this information. FXStreet and the author will not be liable for any errors, omissions or any losses, injuries or damages arising from this information and its display or use. Errors and omissions excepted.
The author and FXStreet are not registered investment advisors and nothing in this article is intended to be investment advice.
Recommended content
Editors’ Picks

EUR/USD stays defensive near 1.1350 as US Dollar looks to stabilize
EUR/USD remains on the back foot for the second consecutive session, trading near 1.1350 in the European trading hours on Tuesday. The pair weakens as the US Dollar attempts to regain stability amid the US-China trade war and growing concerns over US recession. German/ EU data are awaited.

GBP/USD battles 1.3200 after UK jobs data
GBP/USD is defending minor bids near the 1.3200 mark in the early European session on Tuesday. The latest data from the UK showed that Unemployment Rate steadied at 4% in the quarter to February while Average Earnings disappointed, weighing negatively on the Pound Sterling.

Gold price retains its positive bias above $3,200 amid US-China trade war, bearish USD
Gold price regains positive traction as US tariff uncertainty continues to underpin safe-haven assets. Bets for aggressive Fed rate cuts in 2025 keep the USD depressed and also benefit the XAU/USD pair.

XRP resilient amid looming ETF deadlines
Ripple (XRP) flaunted a bullish outlook, trading at $2.1505 at the time of writing on Tuesday. Investor risk appetite has continued to grow since the middle of last week, propping XRP for a sustainable upward move, eyeing $3.0000 psychological level.

Is a recession looming?
Wall Street skyrockets after Trump announces tariff delay. But gains remain limited as Trade War with China continues. Recession odds have eased, but investors remain fearful. The worst may not be over, deeper market wounds still possible.

The Best brokers to trade EUR/USD
SPONSORED Discover the top brokers for trading EUR/USD in 2025. Our list features brokers with competitive spreads, fast execution, and powerful platforms. Whether you're a beginner or an expert, find the right partner to navigate the dynamic Forex market.


