AMC Entertainment Holdings Stock Forecast: AMC surges, weekly RSI back at January overbought levels
- AMC shares spiked again on Thursday, up nearly 15%.
- The cinema chain has been surging nearly non-stop.
- Stock breaks January frenzy highs as RSI is overbought.
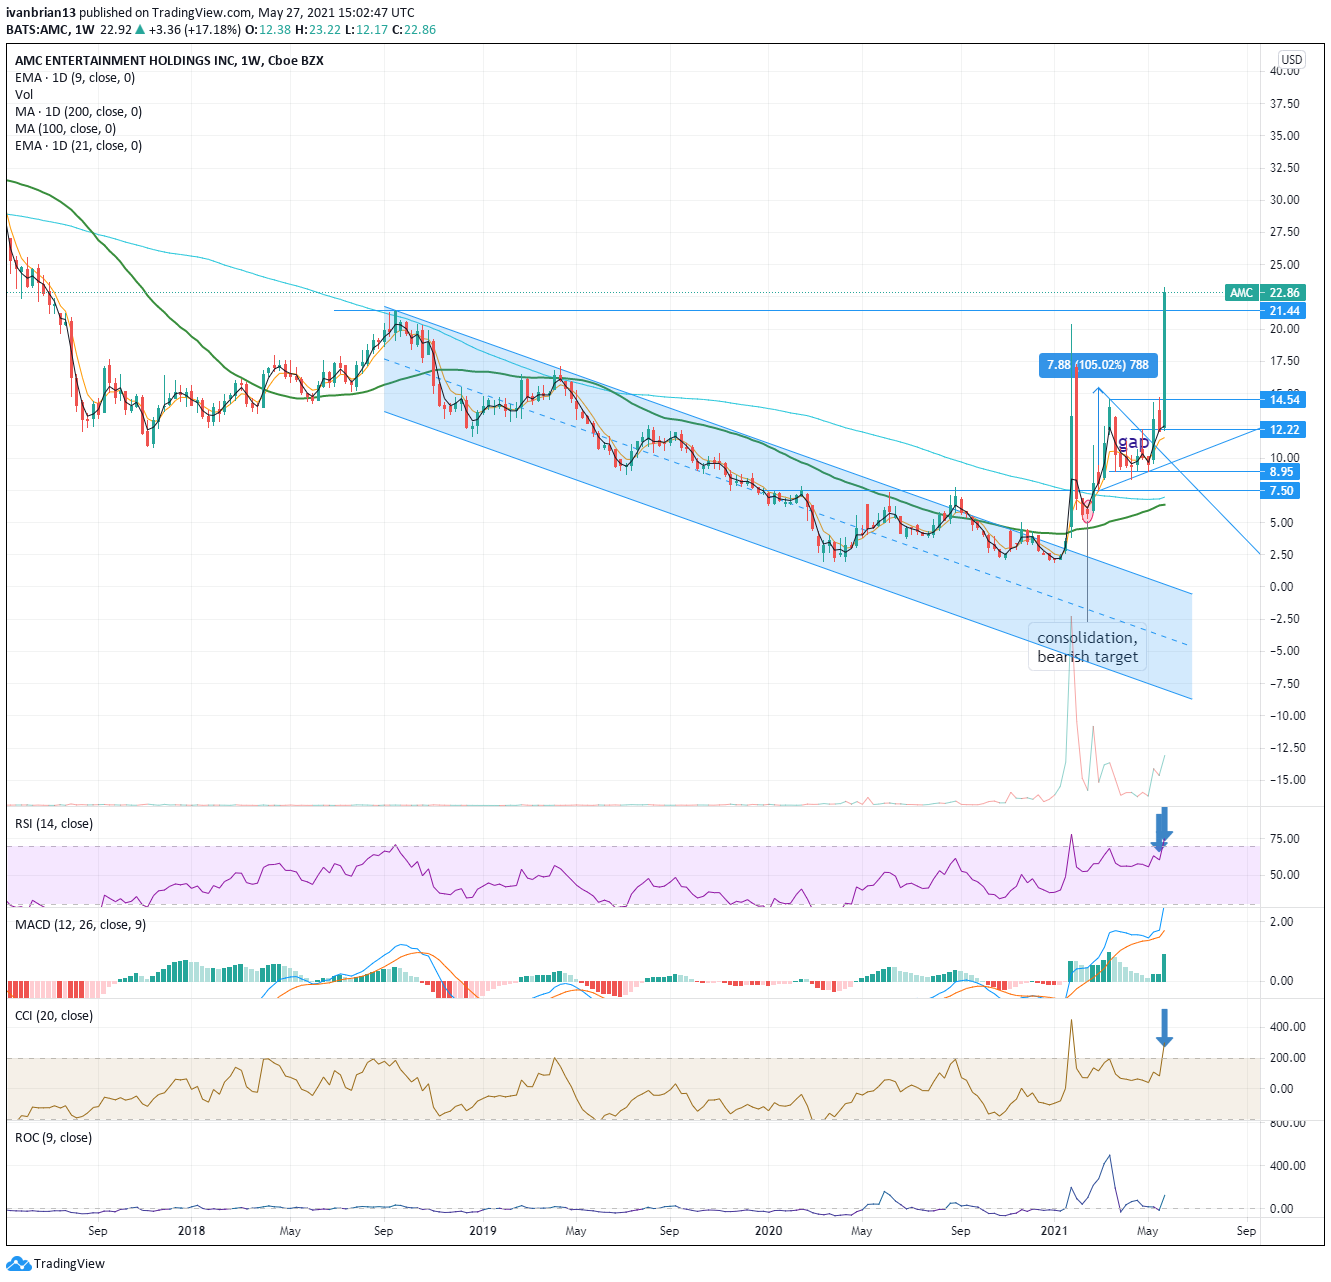
Update: To the moon! AMC is really not happy about the Gamestop movie being made and is determined to show those movie makers who the real star of the show should be. AMC smashes through the January $20.36 high on Thursday, while GameStop (GME) languishes well below its own January high. In the process, AMC shares take out the $21.44 high from September 2018. Caution should be ringing though as the RSI on the weekly chart is now nearly more overbought than back in January, this is confirmed by the Commodity Channel Index (CCI) another momentum indicator.
AMC just keeps on going like a runaway freight train. The momentum was pushing the shares higher again on Wednesday, and they eventually just fell short of the $20 level with a high of $19.95. AMC shares closed out the day for a near 20% rise at $19.56. AMC stock is currently at the time of writing trading higher in Thursday's premarket at $19.60.
AMC stock forecast
On Wednesday FXStreet examined the monthly chart for a longer-term overview of the move and how it had worked nicely from a technical perspective. The breakout in January was confirmed with a surge in volume and an almost perfect retracement and retesting of the $7.50 breakthrough level. The monthly chart also shows the nice base around $2.50 that AMC had formed and defended multiple times. AMC on the monthly chart shows clearly the next major resistance at $21.44 back from 2019.

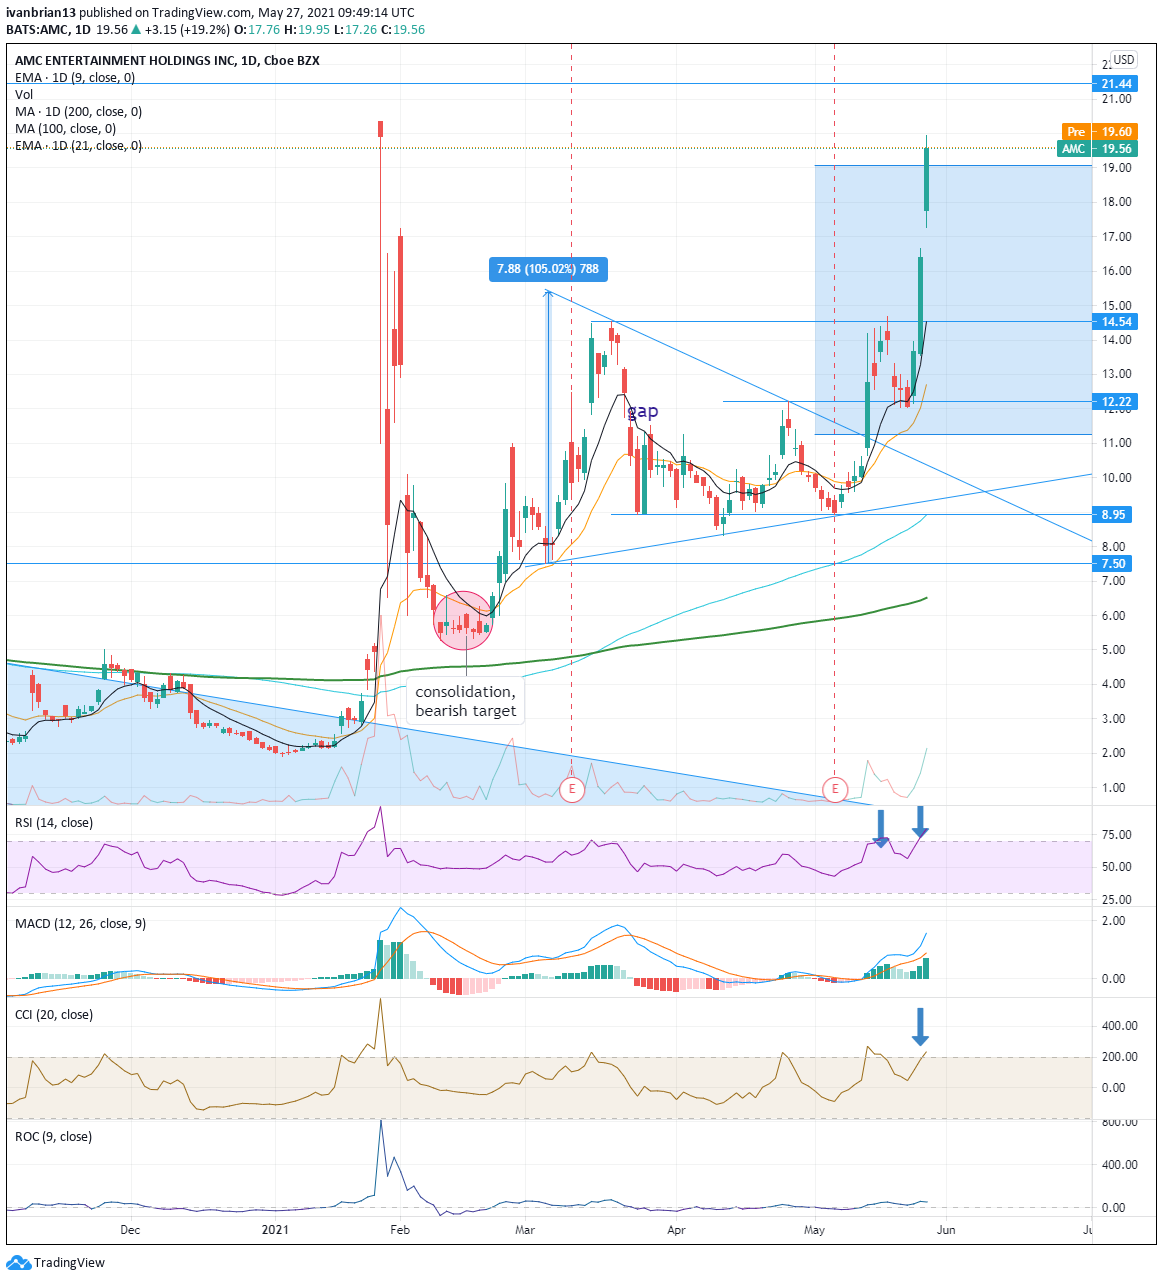
Returning to the daily chart, AMC staged a beautiful breakout of the long-term channel identified on the monthly chart. The catalyst was when AMC finally broke above the 200-day moving average, and it has not looked back since. The triangle formation from March through May was left behind, and the triangle breakout target just above $19 was reached on Wednesday. The target of a triangle breakout is the size of the triangle entry formation wave. Now the next resistance is at $21.44. However, caution should be exercised as both momentum oscillators are now flagging overbought conditions. The Relative Strength Index (RSI) and Commodity Channel Index (CCI) are both pointing that direction. This has worked previously for traders, and two indicators are stronger than one. Caution should be exercised. On Wednesday FXStreet identified the RSI as being overbought, but now the CCI has added to the signal. The 9-day moving average is key to holding the short-term bullish trend as is the previous resistance at $14.54. Breaking below $8.95 turns the longer-term view bearish.
| Support | 14.54 | 12.22 | 9.40 trendline | 8.95 | 6.51 200-day |
| Resistance | 21.44 | 36 | the moon |
At the time of writing, the author has no position in any stock mentioned in this article and no business relationship with any company mentioned. The author has not received compensation for writing this article, other than from FXStreet.
This article is for information purposes only. The author and FXStreet are not registered investment advisors and nothing in this article is intended to be investment advice. It is important to perform your own research before making any investment and take independent advice from a registered investment advisor.
FXStreet and the author do not provide personalized recommendations. The author makes no representations as to accuracy, completeness, or the suitability of this information. FXStreet and the author will not be liable for any errors, omissions or any losses, injuries or damages arising from this information and its display or use. The author will not be held responsible for information that is found at the end of links posted on this page.
Errors and omissions excepted.
Premium
You have reached your limit of 3 free articles for this month.
Start your subscription and get access to all our original articles.
Author

Ivan Brian
FXStreet
Ivan Brian started his career with AIB Bank in corporate finance and then worked for seven years at Baxter. He started as a macro analyst before becoming Head of Research and then CFO.


